Identifying Obstacles to Equitable Flood Mitigation Funding
Authors
Affiliations
Russell Blessing
University of North Carolina at Chapel Hill
Julian Plough
University of North Carolina
Antonia Sebastian
University of North Carolina at Chapel Hill
University of North Carolina
Helena Garcia
University of North Carolina
Miyuki Hino
University of North Carolina at Chapel Hill
University of North Carolina
Published
August 6, 2026
Abstract
Federal flood mitigation funding in the United States flows to homeowners through a multi-stage application process administered by local governments. Identifying barriers to access has been constrained by data: prior studies observe only who receives funding, not who is exposed or who applies. We construct a novel parcel-scale dataset linking flood exposure across 78 events from 1996 to 2020 with FEMA Hazard Mitigation Assistance (HMA) applications and funding outcomes for 3.14 million residential properties in eastern North Carolina. Of the 202,623 flood-exposed properties, about two-thirds are in jurisdictions with at least one HMA application, yet only 5,746 (2.8%) apply, of which 3,432 (59.7%) are funded; the steepest attrition therefore occurs at the application stage rather than at community participation or funding selection. Funded properties are concentrated in lower-value, less-white neighborhoods than the broader flood-exposed population, but within those neighborhoods they fall near the median of the local property-value distribution rather than at its bottom, indicating that value-based selection operates between neighborhoods rather than within them. Repeat-flooded properties apply at roughly twice the rate of once-flooded properties but are funded at essentially the same rate (58.5% vs. 62.0%); because repeat-flooded properties carry higher expected avoided losses, their greater cost-effectiveness does not translate into higher funding. Expanding cost-effective mitigation therefore has two complementary levers: raising application rates among repeat-flooded households, and raising the share of those applicants ultimately funded.
Keywords
Flood mitigation, Climate resilience
In [1]:
library(readr)library(dplyr)
Attaching package: 'dplyr'
The following objects are masked from 'package:stats':

    filter, lag
The following objects are masked from 'package:base':

    intersect, setdiff, setequal, union
Flooding is the most costly natural hazard in the United States, and climate change is projected to intensify both its frequency and its financial burden (Environmental Information 2024). An estimated 41 million people live within the 1% flood hazard area, and the populations most exposed are disproportionately low-income, Black, and Native American (Tate, Rahman, and Emrich 2021). In response to mounting losses, federal investment in hazard mitigation assistance has grown substantially over the past decade, from $748 million in 2015 to nearly $2.8 billion in 2024, averaging over $1.2 billion per year (Federal Emergency Management Agency 2024a).1 Yet several recent studies have suggested that this investment may not be reaching those who need it most. Nationwide analyses find that wealthier and whiter communities have secured more federal mitigation funding, while racially and economically marginalized communities have received comparatively less (Mach et al. 2019; Elliott, Brown, and Loughran 2020; Loughran and Elliott 2022). Several mechanisms have been proposed to explain this pattern, including federal cost-benefit valuation that tends to favor higher-value properties (Elliott, Brown, and Loughran 2020), variation in local government capacity to apply for and administer grants (Mach et al. 2019), and household-level barriers that shape mitigation behavior (Bubeck, Botzen, and Aerts 2012; Binder et al. 2023). Past studies, however, have relied on data on who receives funding, not who is eligible or who applies. As a result, it remains unclear where in the process inequities first emerge and which interventions would most effectively improve access.
Empirical evidence on each of these proposed mechanisms remains uneven. The most direct evidence comes from research on adjacent FEMA programs. In the Individuals and Households Program (IHP), which provides post-disaster assistance through a similar application-based structure, denials fall disproportionately on applicants in more socially vulnerable areas — those scoring higher on the Social Vulnerability Index (SoVI), a composite of demographic and socioeconomic Census indicators (Drakes et al. 2021). Rivera, Jenkins, and Randolph (Rivera, Jenkins, and Randolph 2022) documented that following Hurricane Dolly in 2008, 50 to 71 percent of IHP applications from Rio Grande Valley colonias were rejected, largely because FEMA’s unclear definitions of “deferred maintenance” and “insufficient damages” disqualified households whose home damage could not be cleanly attributed to the disaster event. While these findings concern post-disaster assistance rather than pre-disaster mitigation, the underlying mechanism of application-stage barriers that disadvantage already-marginalized communities plausibly operates in HMA as well. FEMA itself has acknowledged that limited local capacity is a barrier to accessing federal mitigation resources. The agency convened a Place-Based Technical Assistance Task Force in 2023 to coordinate cross-agency support for communities that “have limited capacity to access and implement certain resources” (Federal Emergency Management Agency 2026), and within the Building Resilient Infrastructure and Communities (BRIC) program launched a Direct Technical Assistance initiative providing hands-on application support to under-resourced communities and tribal nations.
Here, we combine novel datasets spanning over two decades of flood exposure, grant applications, and funding allocations in North Carolina to examine the full flooded-to-funded HMA pipeline (Figure 1). Flood exposure is derived from random forest models trained on address-level National Flood Insurance Program (NFIP) records. Although trained on the NFIP sample, the models interpolate to generate spatially continuous inundation footprints covering the entire study area, so flood exposure is estimated for all parcels regardless of insurance status. We retain footprints for 78 damaging events between 1996 and 2020 (Garcia et al. 2025). We link these exposure records to property-level application and funding data for FEMA Hazard Mitigation Assistance (HMA) grant programs, provided by the North Carolina Department of Public Safety (NCDPS).
Together, these datasets allow us to track individual properties across four stages: (1) whether the property flooded, (2) is located in an applying community, (3) applied themsleves, and (4) recieved funding. We then used this staged data to examine how the composition of properties shifts in terms of flood exposure history, property value, and neighborhood racial demographics at each transition. This is the first analysis to follow properties from flood exposure through to mitigation funding outcome at the property level, making it possible to distinguish between households applying and not being selected and those that never enter the applicant pool at all.
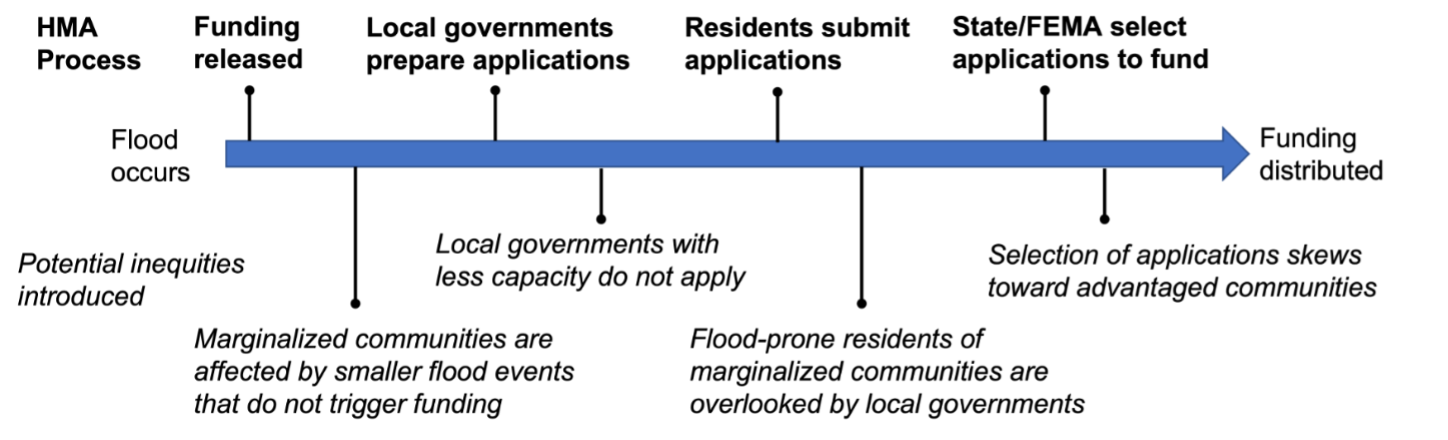
Figure 1: The application process for FEMA Hazard Mitigation Assistance funding presents different barriers to access at each stage. Diagram shows a simplified set of stages from flooded to funded (top), and the associated ways in which potentially inequitable outcomes could arise at each stage (bottom).
Access to federal funding for climate resilience
The federal government is the primary source of public assistance for disaster risk mitigation, post-disaster relief, and long-term recovery in the United States. Many federal agencies contribute to these efforts, including the US Army Corps of Engineers (which is responsible for large-scale flood-control infrastructure), the Department of Housing and Urban Development (which administers Community Development Block Grant Disaster Recovery funds), the National Oceanic and Atmospheric Administration, and the Environmental Protection Agency. We focus our analysis on the Federal Emergency Management Agency (FEMA), which leads disaster response and administers the nation’s largest hazard mitigation grants. These programs — delivered through FEMA’s Hazard Mitigation Assistance (HMA) framework — include the post-disaster Hazard Mitigation Grant Program (HMGP), which is triggered by presidential disaster declarations (PDDs); Flood Mitigation Assistance (FMA), an annually appropriated program targeting flood-insured properties; and Building Resilient Infrastructure and Communities (BRIC), a competitive pre-disaster program that replaced Pre-Disaster Mitigation (PDM) in 2020. FEMA made over $1.6 billion available through BRIC and FMA alone in FY2024, with demand for these competitive funds regularly exceeding the available pool.
Concerns about equitable access to FEMA assistance in the aftermath of disasters have been extensively documented, where race, sex, and other social determinants are associated with differential rates of participation regardless of need. Following presidential disaster declarations, FEMA’s Individuals and Households Program (IHP) provides up to approximately $44,000 per household for temporary housing, property repair, unemployment assistance, and other immediate needs (Federal Emergency Management Agency (2024d)). Racial and income disparities in IHP access have been observed across a wide range of events, including the 1994 Northridge earthquake (Bolin and Stanford 1998), Hurricane Katrina (Kamel 2012), Hurricane Dolly in South Texas (Rivera, Jenkins, and Randolph 2022), and the 2017 Thomas Fire (Méndez, Flores-Haro, and Zucker 2020). More broadly, studies find that social vulnerability is inversely associated with access to federal disaster recovery funds even after accounting for the extent of damage (Emrich, Aksha, and Zhou 2022; Drakes et al. 2021; Wilson, Tate, and Emrich 2021; Bento and Elliott 2022).
Similar concerns have emerged around FEMA’s risk mitigation programs, which fund long-term adaptation rather than immediate recovery. Typical Hazard Mitigation Assistance (HMA) projects include home elevations, property buyouts, and community-scale infrastructure; since 2020, the BRIC program has expanded community-wide project funding. Among property-scale programs, buyouts have received the most scrutiny. In a buyout, homeowners sell flood-prone properties to local governments, which demolish structures and restore the land to open space. Initiated in 1985 and now totaling over 43,000 completed transactions nationally, the buyout program has shifted from its rural origins into an increasingly urban policy (Mach et al. 2019). Its geographic distribution is deeply uneven: states with the highest cumulative flood losses (total dollars) account for comparatively few buyouts (number of properties acquired), while nationally, buyout activity concentrates in wealthier, denser counties with greater administrative capacity (Mach et al. 2019). Within those counties, bought-out properties are concentrated in lower-income and more racially diverse neighborhoods, a pattern Mach et al. (2019) describe as a “buyout paradox” in which government capacity governs access at the county scale while within-county selection follows a different logic (Elliott, Brown, and Loughran 2020; Loughran and Elliott 2022). By contrast, reporting on FEMA elevation grants suggests that funding may flow disproportionately toward high-income and predominantly white communities (Frank 2022).
Procedural challenges to accessing funding
While these program-level barriers shape outcomes at a broad scale, the mechanisms that produce inequity operate at the level of specific program rules and local implementation practices. The HMA application process is lengthy and multi-layered. After federal funding is released, state, tribal, and local governments identify eligible properties, assist homeowners in compiling required documentation (including cost-benefit analyses, insurance records, and title documentation), and submit project proposals. Local governments (“sub-applicants”) forward proposals to the state (“applicant”), which screens projects before submitting to FEMA for final review. For HMGP-funded buyouts, the full process from disaster declaration to project closeout averages nearly six years (Mach et al. 2019). The federal government typically covers 75% of project costs, with states, local governments, and in some cases homeowners responsible for the remaining 25% non-federal match. Higher federal shares apply in specific circumstances — up to 90% for small, lower-income communities across programs, and, under FMA, up to 90% for Repetitive Loss and 100% for Severe Repetitive Loss properties.
Inequities can arise at every stage. At the local government level, administrative capacity is the primary bottleneck: governments with dedicated staff, prior grant experience, and stronger institutional networks are far more effective at developing and submitting competitive proposals (Mach et al. 2019; Junod et al. 2021). At the community and household level, outreach practices vary widely; some local governments proactively contact eligible residents and guide them through the application process, while others do little or nothing, effectively limiting access to only those homeowners already aware of the program. Providing the 25% non-federal cost share can also be a barrier. In some states, including North Carolina, the state government covers the matching share for HMGP buyout projects under disaster declarations (North Carolina Department of Public Safety 2026). Where the state does not, the match must come from local government budgets or individual homeowners — and sometimes from community organizations or nonprofits, though we do not observe these contributions in our data. Reliance on these sources can significantly constrain participation among cash-strapped jurisdictions and lower-income households.
At the household level, procedural requirements such as documentation, inspections, and legal title verification can impose substantial compliance burdens. While these requirements apply uniformly to applicants, the practical difficulty of meeting them is likely to vary systematically with household resources, mirroring documented patterns in IHP access (Rivera, Jenkins, and Randolph 2022; Raker 2023). Finally, federal cost-benefit analysis (CBA) requirements may further filter the pool. CBA evaluates projects on a benefit-to-cost ratio in which avoided losses scale with property replacement value, leading to concerns that applications from lower-value properties could face systematic disadvantages in the benefit-to-cost ratio (Tate, Rahman, and Emrich 2021; Junod et al. 2021; Miller 2023). This expectation is complicated, however. Project costs also rise with property value, and some projects (i.e. acquisitions of substantially damaged homes, or any project under $1 million) can qualify as cost-effective without a property-specific benefit-cost analysis, relying instead on pre-calculated benefits or a simplified written justification (Federal Emergency Management Agency 2024c, 2024b). Whether CBA, on net, pushes funded properties toward higher or lower property values therefore remains an open empirical question.
Results
We track 3.14 million residential parcels across 78 counties in eastern North Carolina through four sequential stages of the federal HMA pipeline: flooded (intersection with any of 78 modeled flood-event footprints from 1996 through 2020), in an applying community (jurisdiction with at least one HMA application submitted during the study period), applied (parcel itself named on an HMA application), and funded (application ultimately awarded). Flood-exposure data come from flood extent maps created using random forest models trained on NFIP claims and policies-in-force (Garcia et al. 2025), application and funding records from the North Carolina Department of Public Safety, and neighborhood demographics from the 2013 American Community Survey at the block-group scale. Property values come from the CoreLogic database and are expressed as percentile ranks across the study-area sample. Detailed methods are described in the Materials and Methods section.
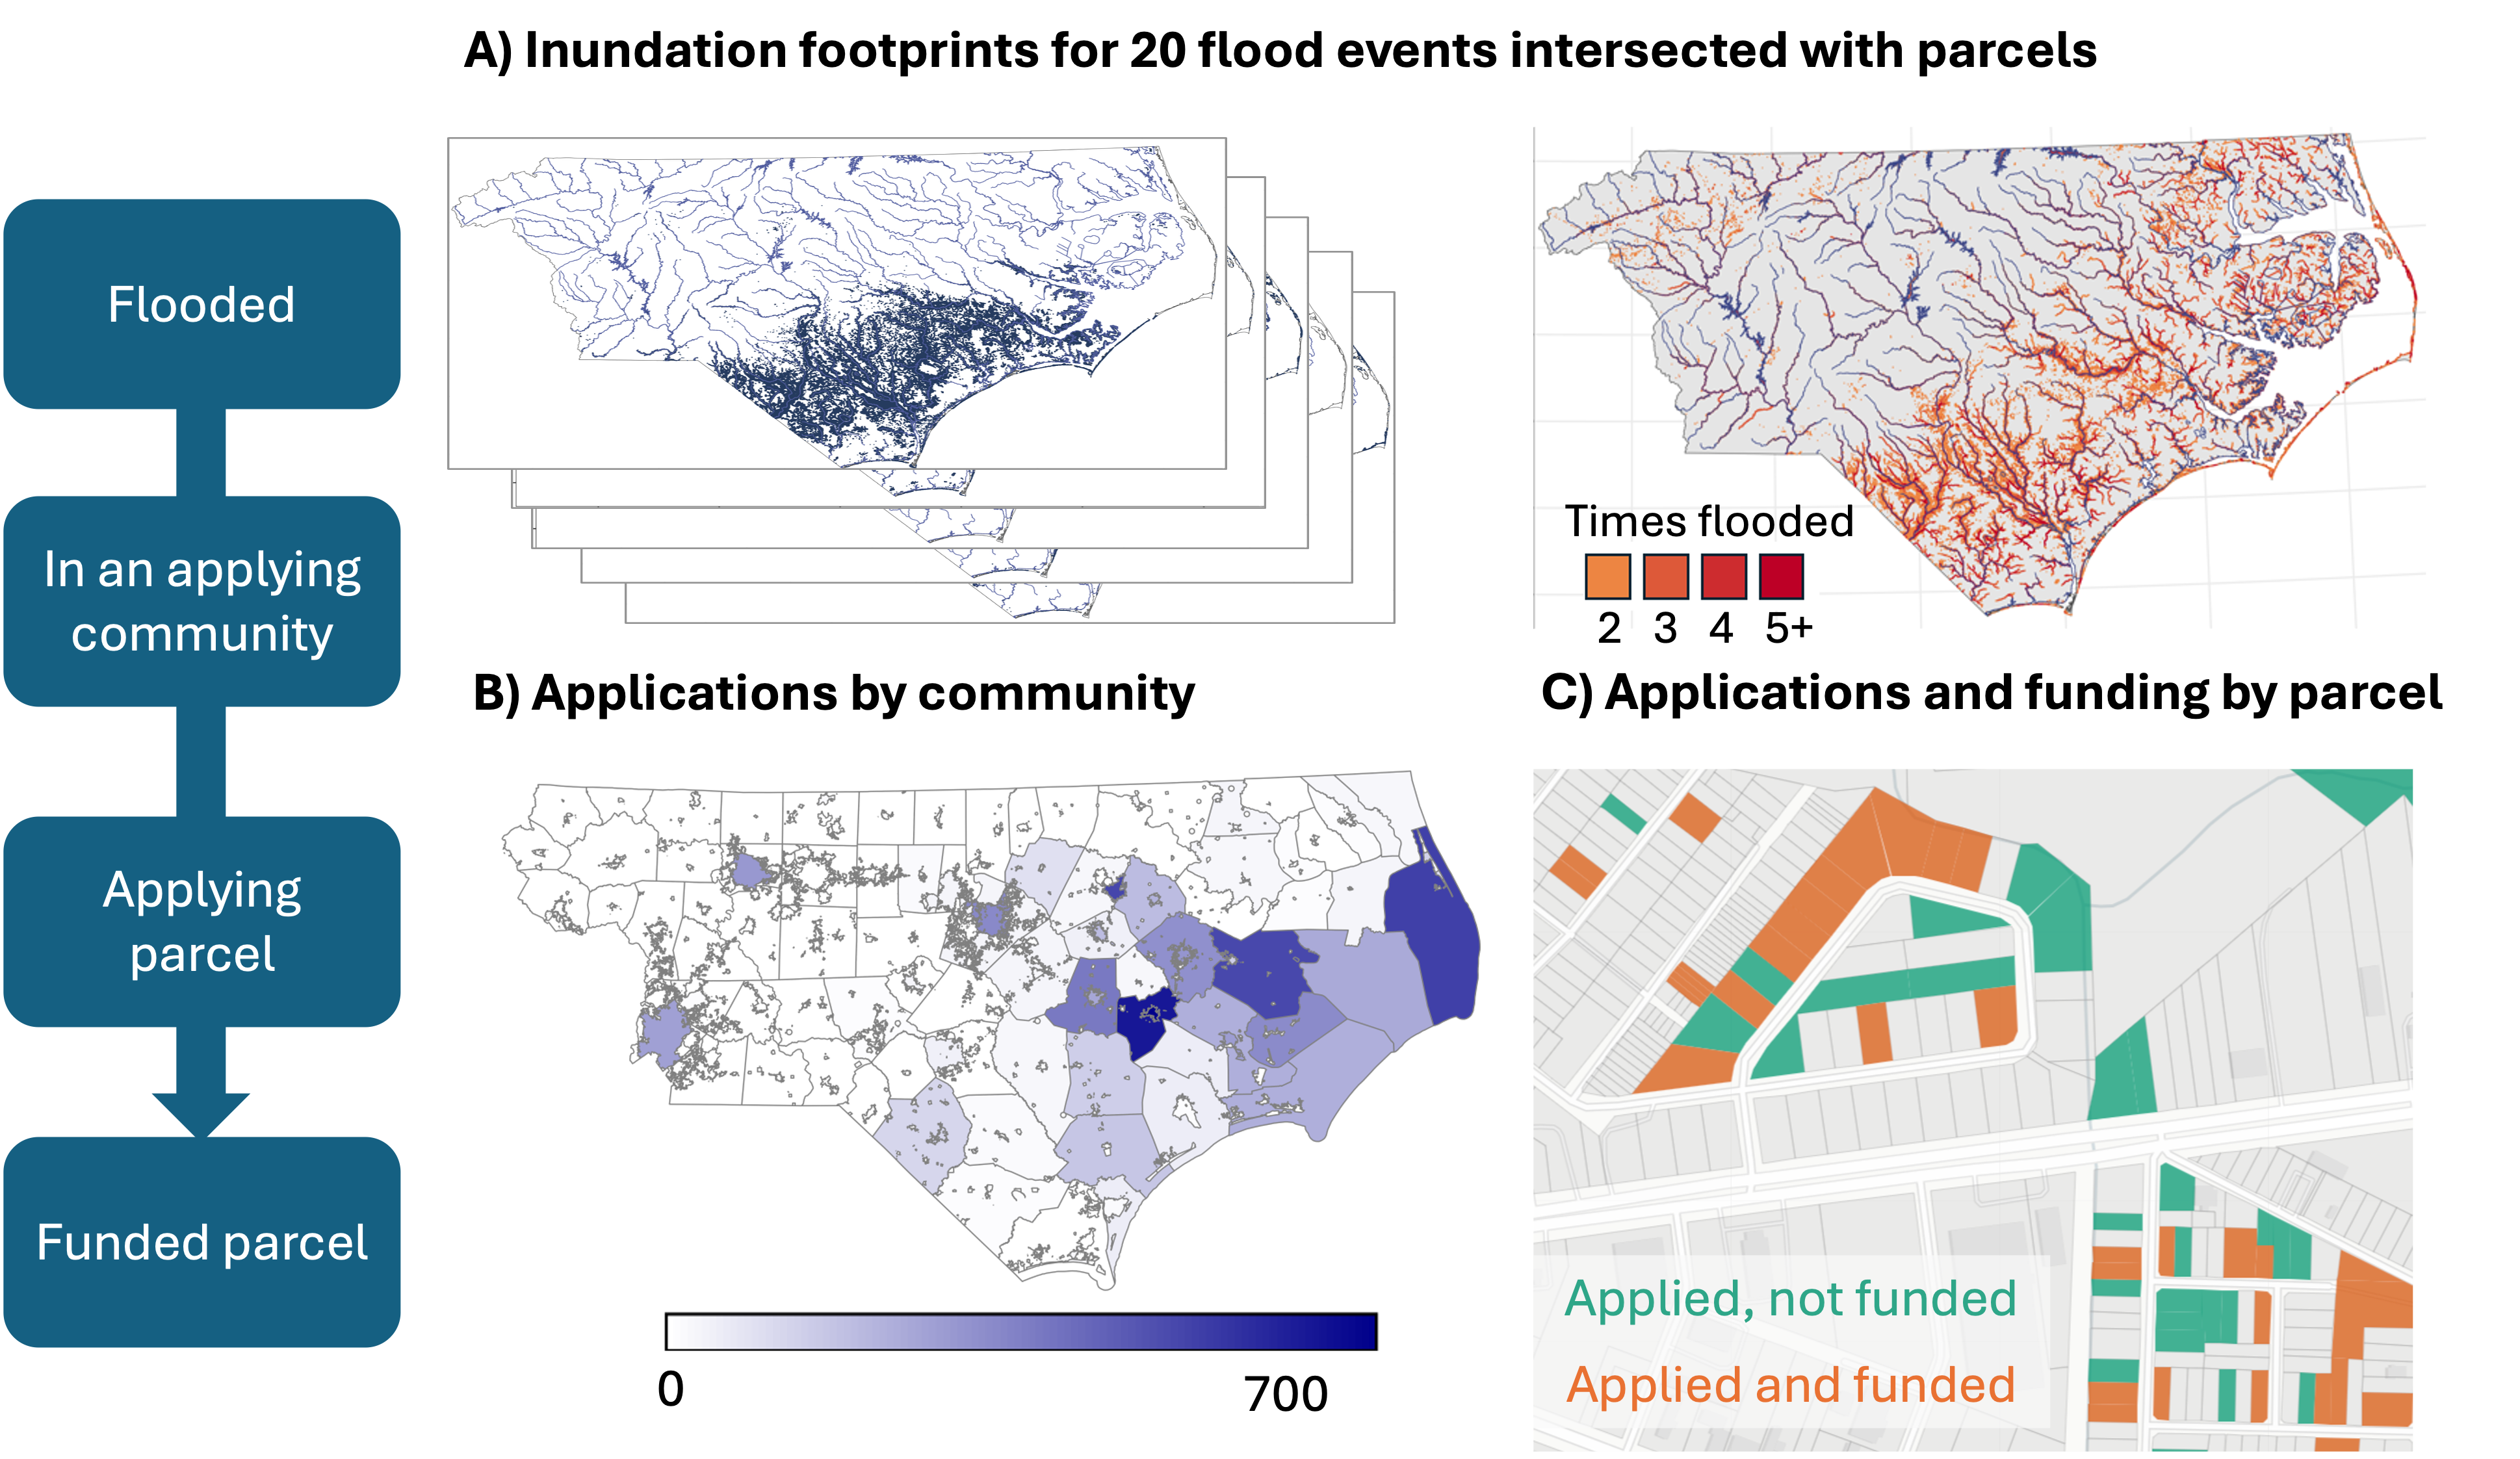
Figure 2: Spatial distribution of properties across the flooded-to-funded pipeline. Left: schematic of the four sequential pipeline stages tracked in our analysis. Top-left: flooded parcels (n = 202,623) across the 78-county study area, with stacked footprints from 78 modeled flood events between 1996 and 2020. Top-right: repetitive residential flooding, with cells colored by the number of modeled flood events affecting each location (2, 3, 4, or 5+ events). Bottom-left: jurisdictions classified as applying communities (shaded by share of eligible parcels named on at least one HMA application). Bottom-right: representative neighborhood showing individual parcels named on HMA applications, distinguished by funding outcome (applied but not funded vs. applied and funded).
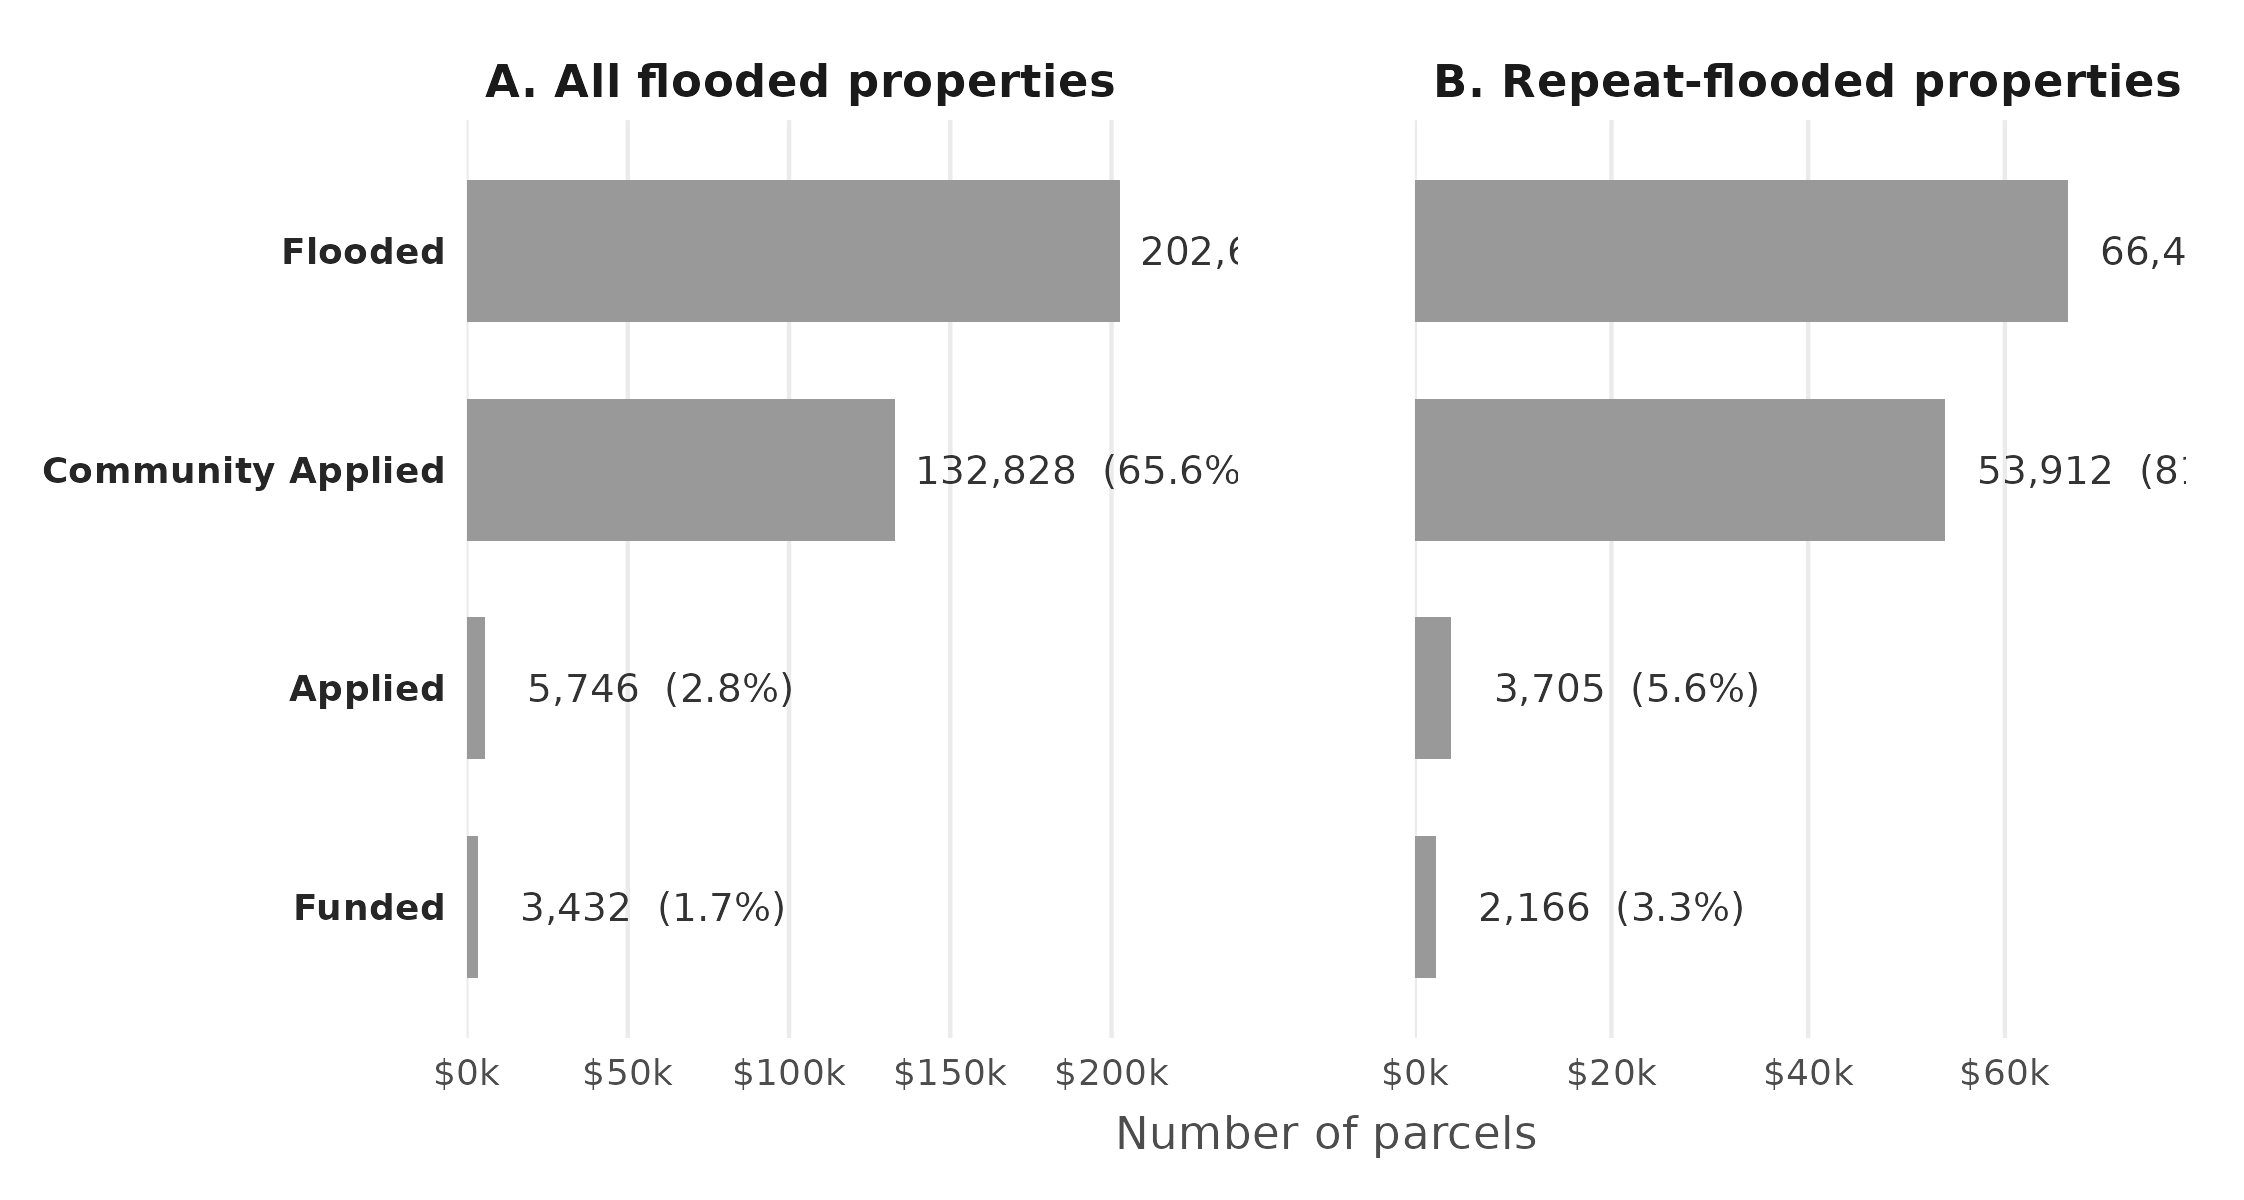
Among all flooded properties (Figure 3, Panel A), 65.6% are in jurisdictions where the local government submitted at least one HMA application, yet only 2.8% apply themselves. Of those that apply, 59.7% are funded — just 1.7% of all flooded properties. The steepest attrition occurs at the application step, not at community participation or funding selection.
Approximately 32.8% of flooded properties were exposed to more than one of the 78 modeled events (Figure 3, right panel). Repeat-flooded properties are more likely to be located in jurisdictions with at least one HMA application (81.1% versus 65.6% among all flooded properties) and apply at roughly twice the rate of once-flooded properties (5.6% versus 2.8%). However, the share of applications that ultimately receive funding is essentially the same across the two groups (58.5% versus 59.7%), indicating that while greater flood exposure increases the likelihood of applying, it does not appear to influence selection likelihood among those who do apply.
Figure 3: The application stage is the largest attrition point in the HMA pipeline: fewer than 3% of flooded properties ever submit an application. Bars show the number of 1–4 family residential parcels at each of four pipeline stages: flooded in any of the 78 modeled events; in an applying community (jurisdiction with at least one HMA application during the study period); itself named on an HMA application; and ultimately funded. Panel A: all flood-exposed parcels (n = 202,623). Panel B: parcels exposed to flooding in more than one event (n = 66,443). Repeat-flooded properties apply at roughly twice the rate of once-flooded properties but are funded at similar rates.
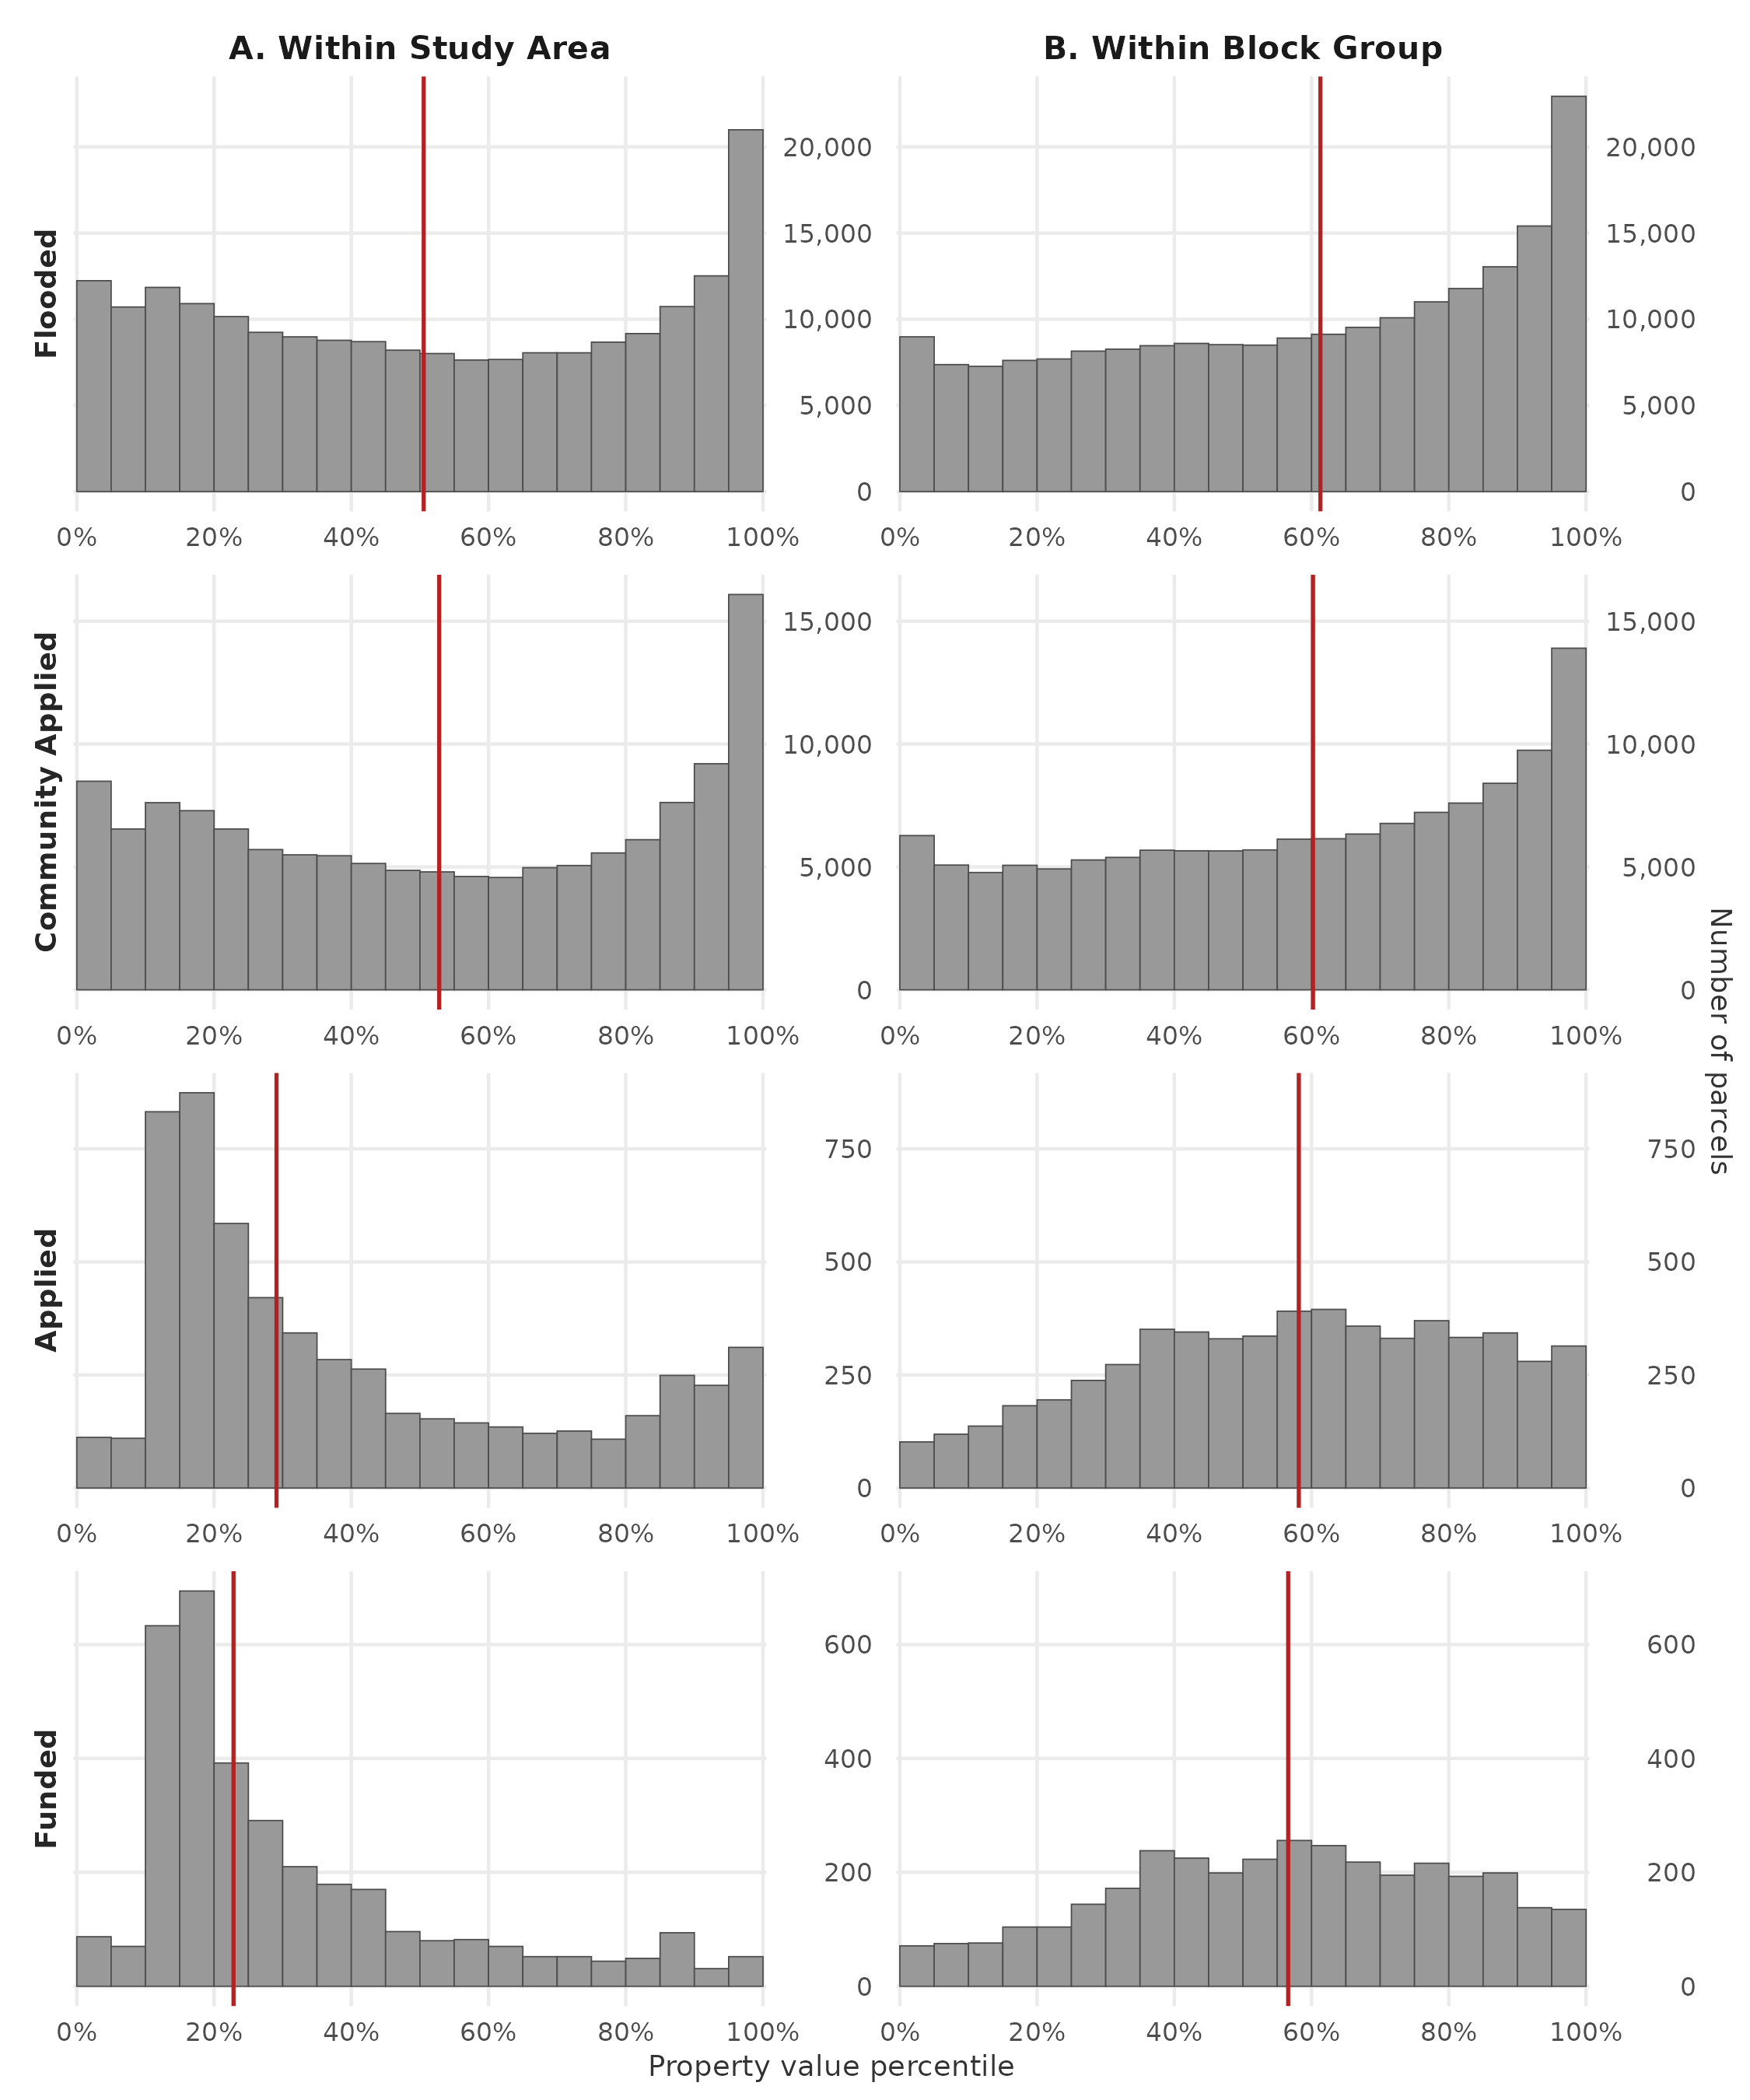
Figure 4: Funded properties are lower-value than the broader flood-exposed population, but are not the lowest-value homes within their own neighborhoods. (A) Distribution of property values for parcels reaching each stage of the flooded-to-funded pipeline, expressed as percentile ranks relative to the entire study-area sample. (B) The same distributions, expressed as percentile ranks within each parcel’s block group. Property values are from CoreLogic (2022 dollars); red vertical lines mark stage medians.
Property values shift substantially across pipeline stages, both relative to the broader study area and within each property’s own block group (Figure 4). Properties that flooded or that reside in communities with at least one HMA application have median values near the 51th–53th percentile of the study-area sample (Panel A). The median value for properties that apply for funding drops to the 29th percentile, and the median for those that are funded is even more affordable at the 23rd percentile. Panel B re-ranks each property against other parcels in its own block group, with all stages clustering near the 60th percentile (Flooded: 61st, Funded: 57th). The much larger spread in Panel A, where flooded properties are within the 51st percentile and funded properties at the 23rd, indicates that the property-value shift across pipeline stages is driven by selection between neighborhoods rather than within them. Funded properties are not the lowest-value homes in their neighborhoods — they sit slightly above the local median (around the 57th percentile), a position that changes little across pipeline stages. Two-sample Kolmogorov–Smirnov tests echo this contrast: the property-value distribution shifts substantially between the flooded and funded stages relative to the study area (D = 0.342) but much less within block groups (D = 0.126). The shift toward lower-value properties therefore operates between neighborhoods rather than within them.
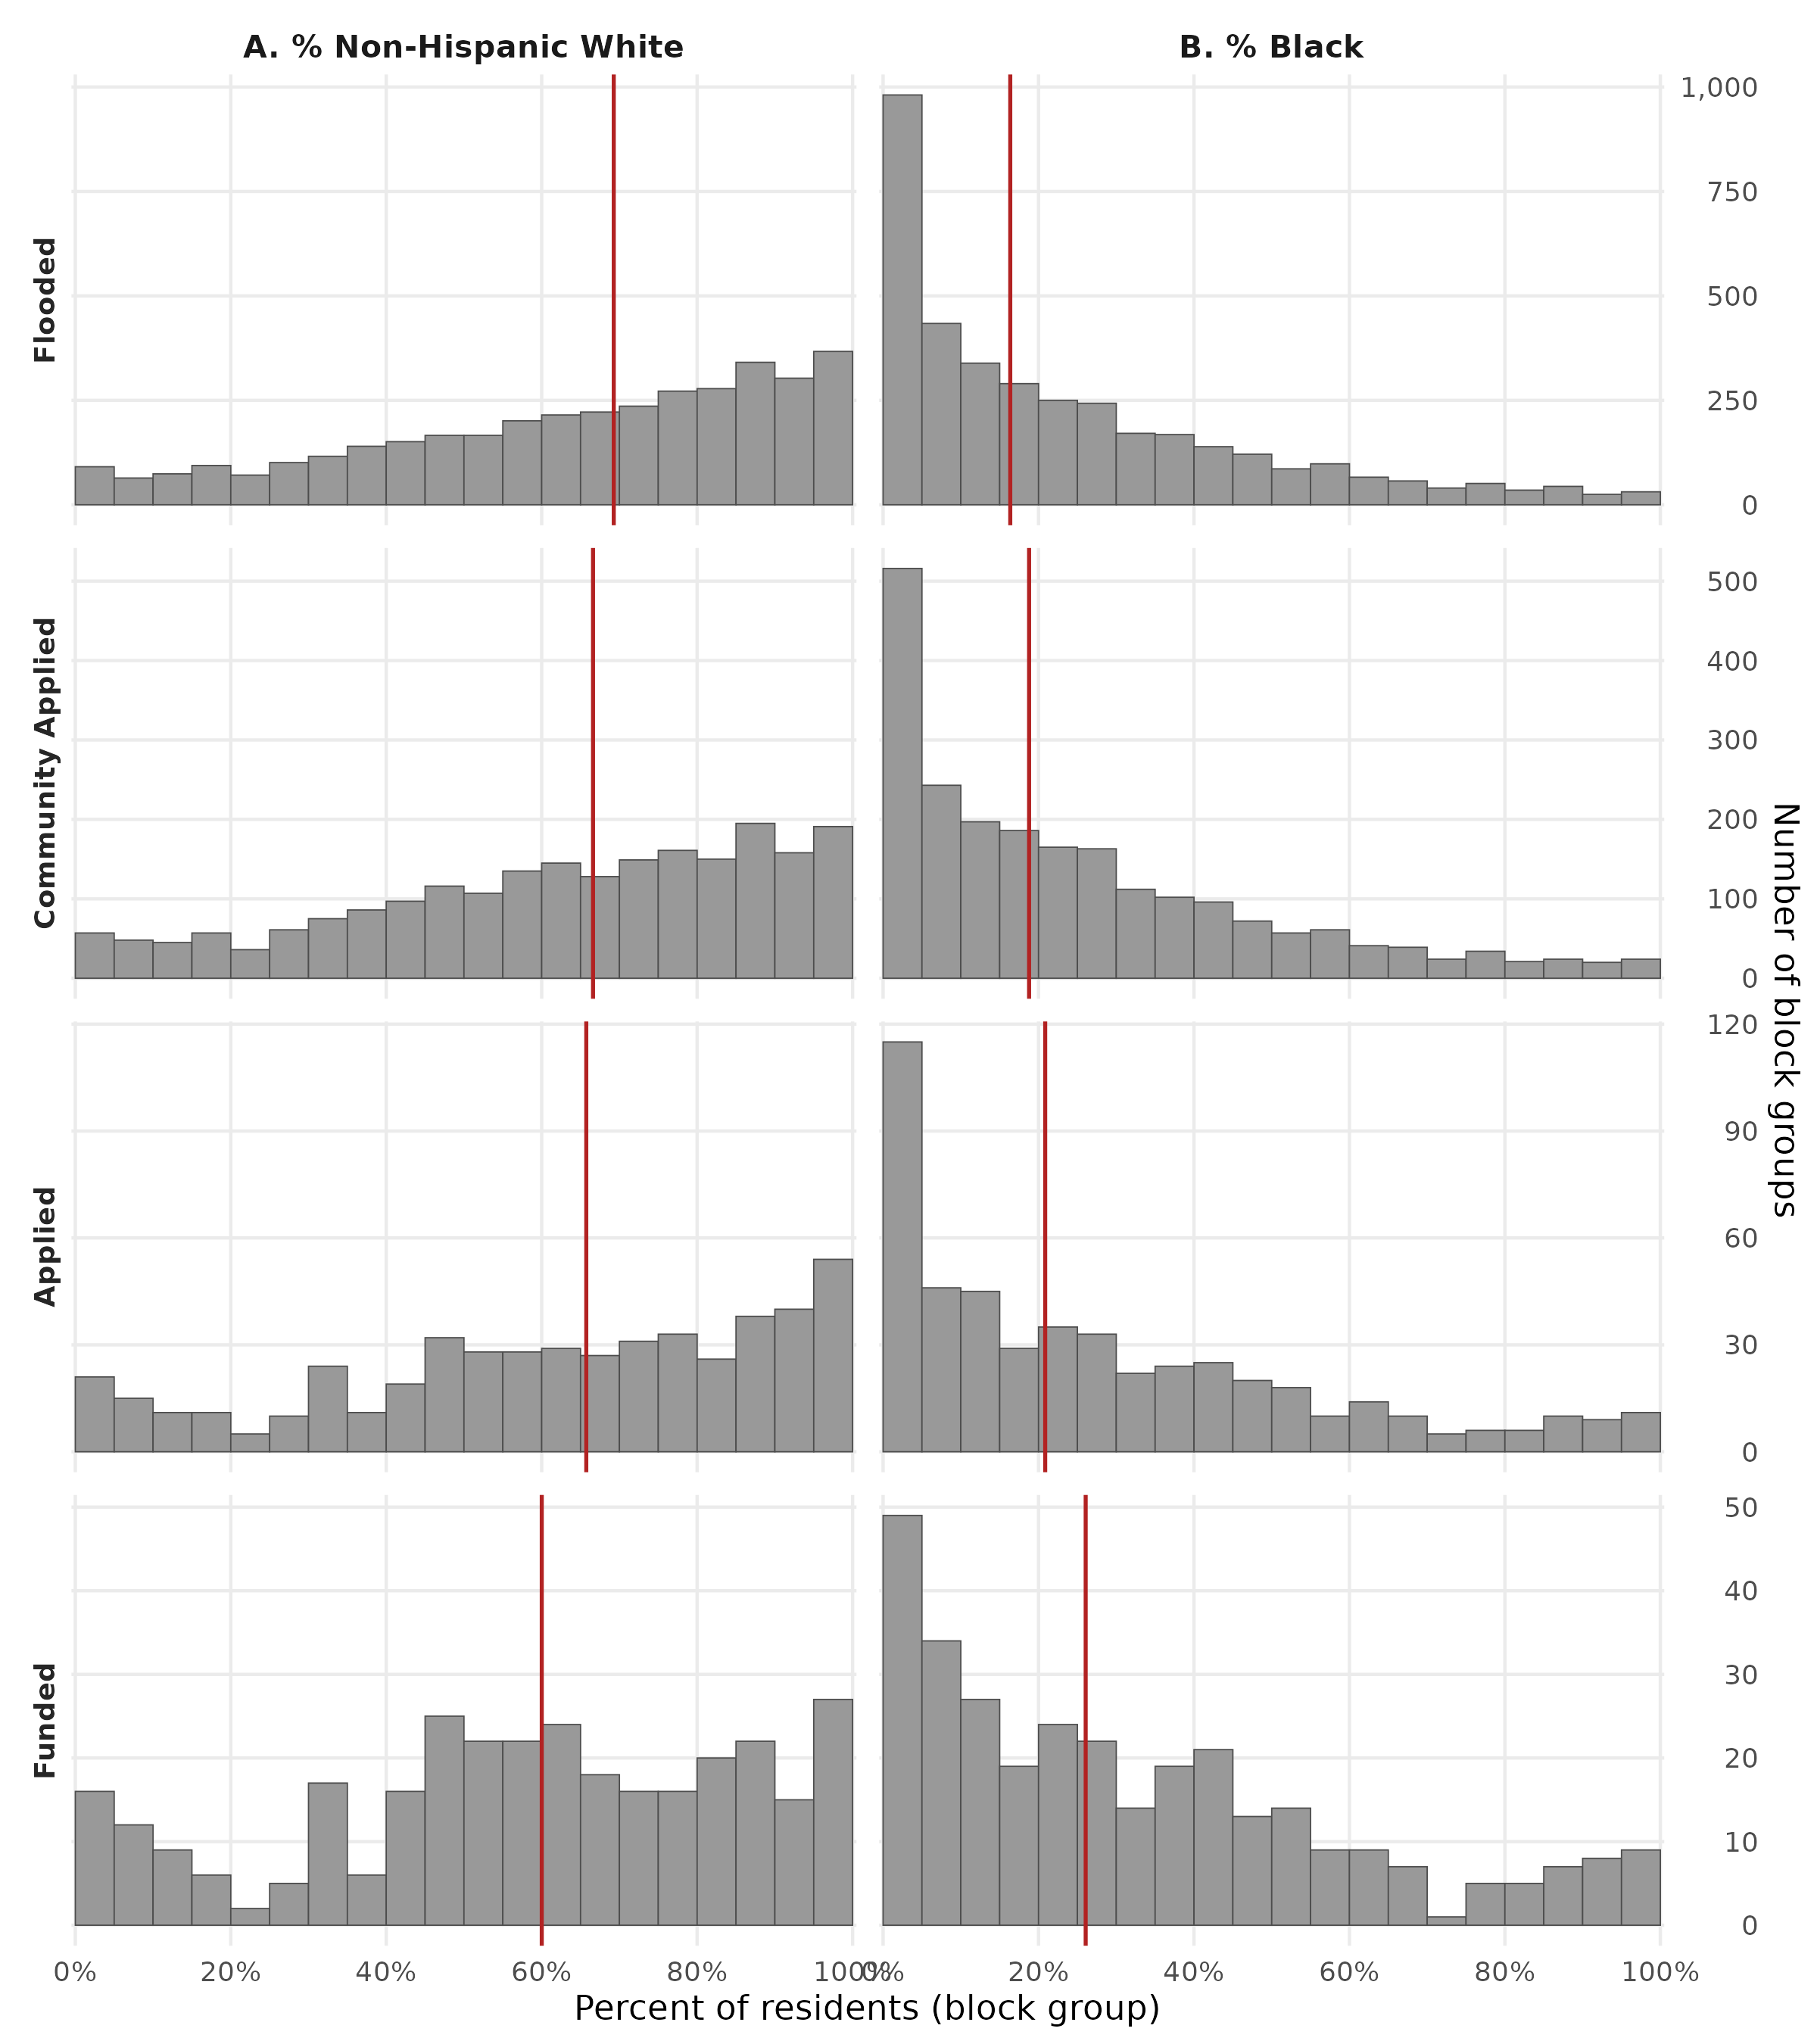
Figure 5: Funded properties are more likely to be in less-white, more-Black neighborhoods than the broader flood-exposed population. (A) Percentage of non-Hispanic White residents. (B) Percentage of Black residents. One observation per block group containing ≥ 1 residential parcel reaching the stage; demographic data from the 2013 ACS 5-year estimates. Red vertical lines mark stage medians.
Properties applying for and receiving mitigation funding are located in block groups with lower shares of non-Hispanic White residents and correspondingly higher shares of Black residents than block groups at preceding pipeline stages (Figure 5). Two-sample Kolmogorov–Smirnov tests show that the block-group racial-composition distributions shift substantially between the flooded and funded stages (NH White: D = 0.131; Black: D = 0.151). Median NH White share declines from 69.3% at the flooded stage to 60.0% at funded properties, with a near-symmetric rise in Black share from 16.4% to 26.1%.
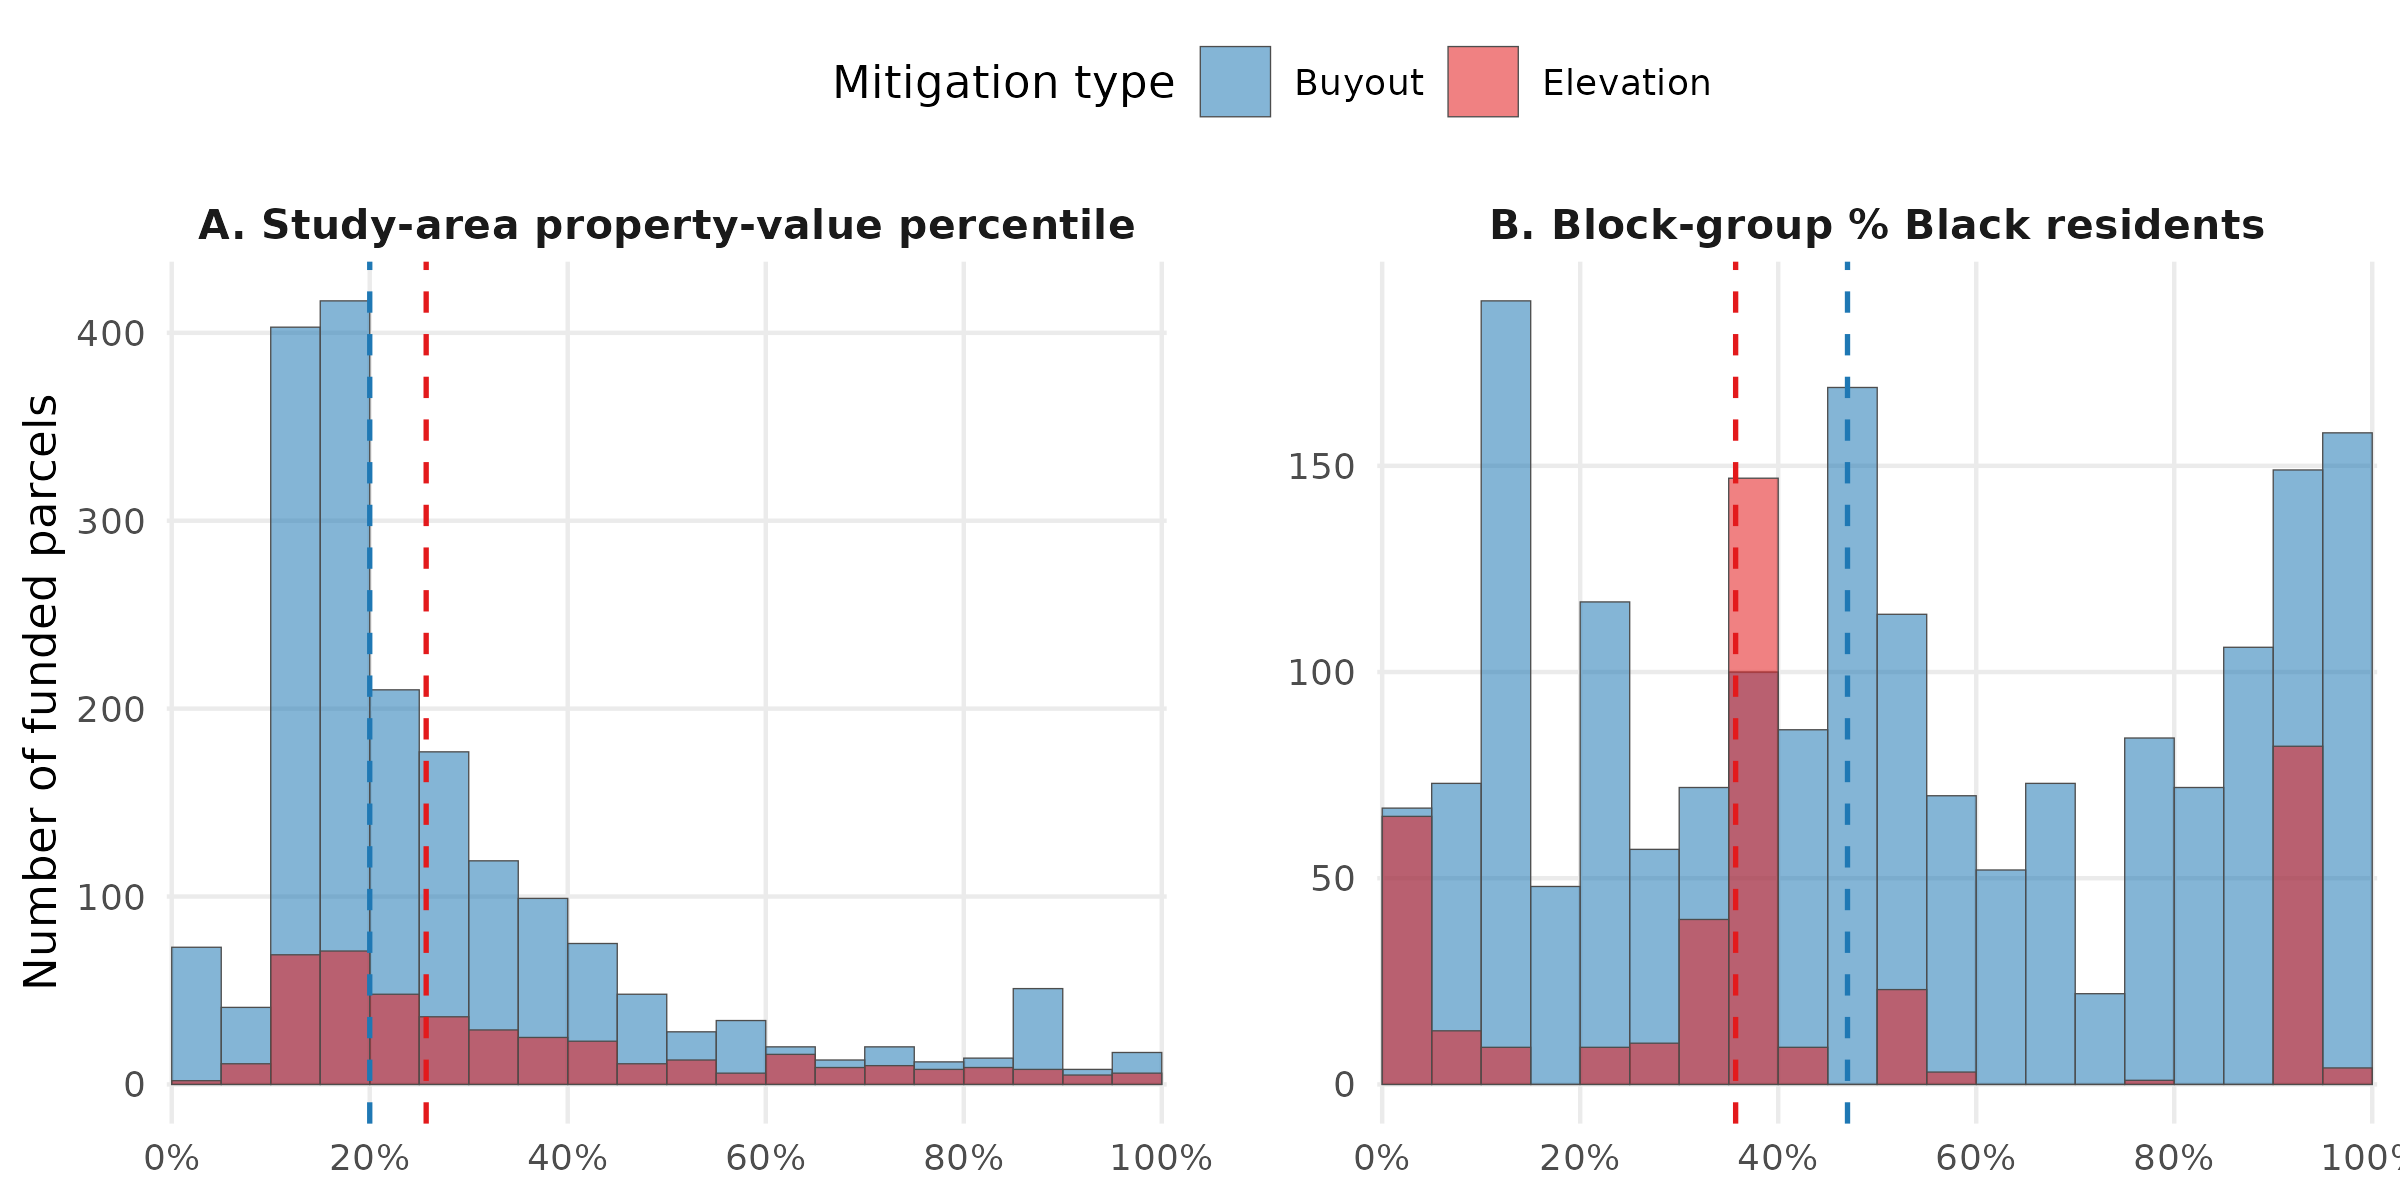
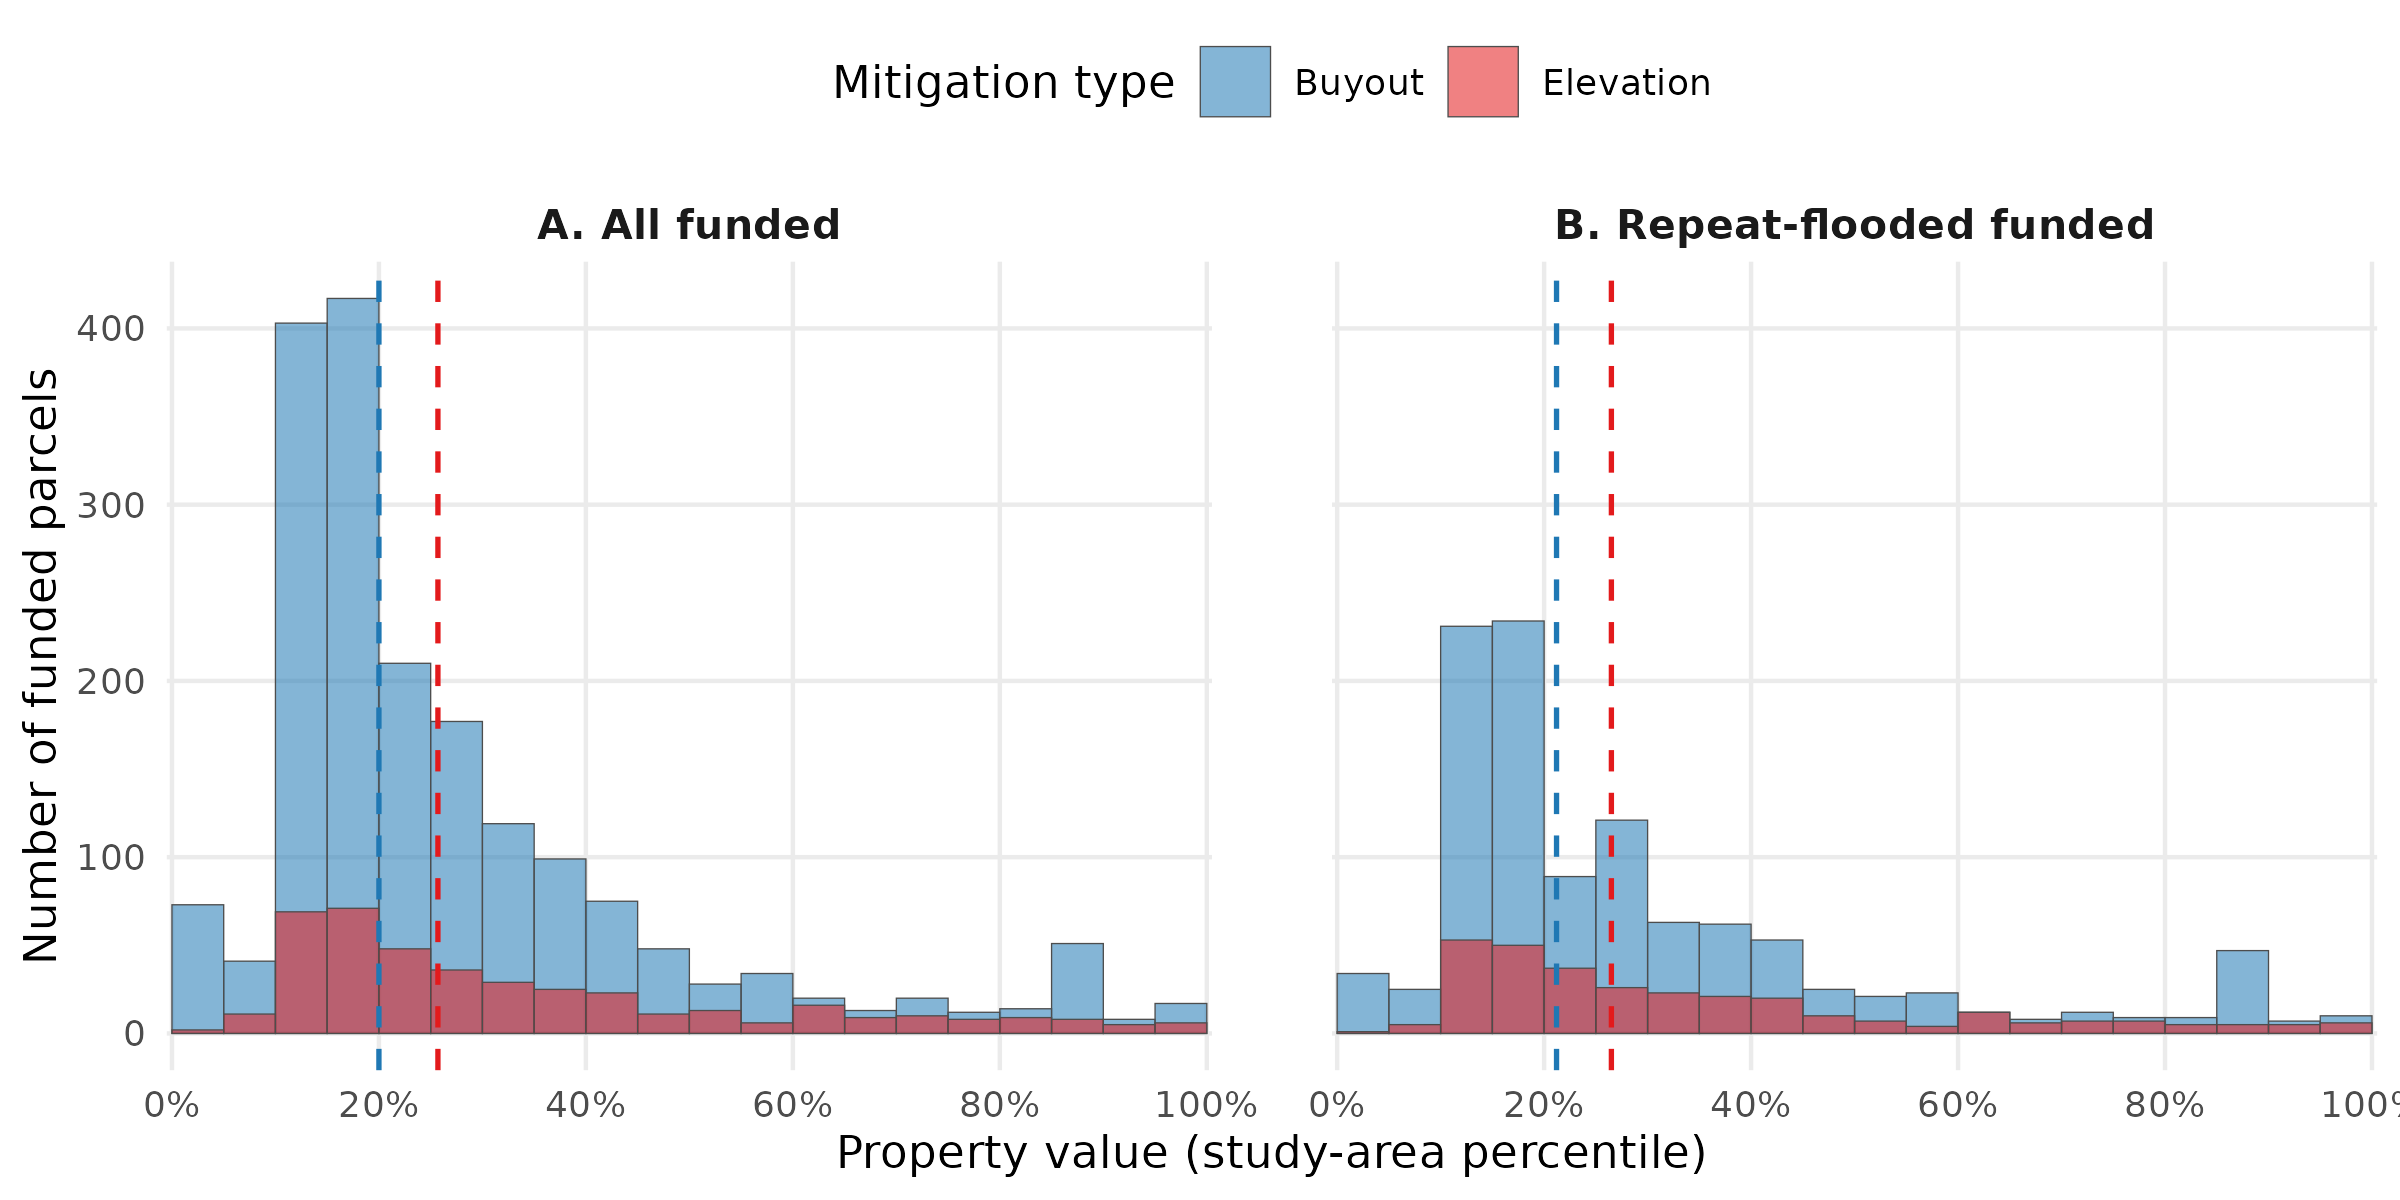
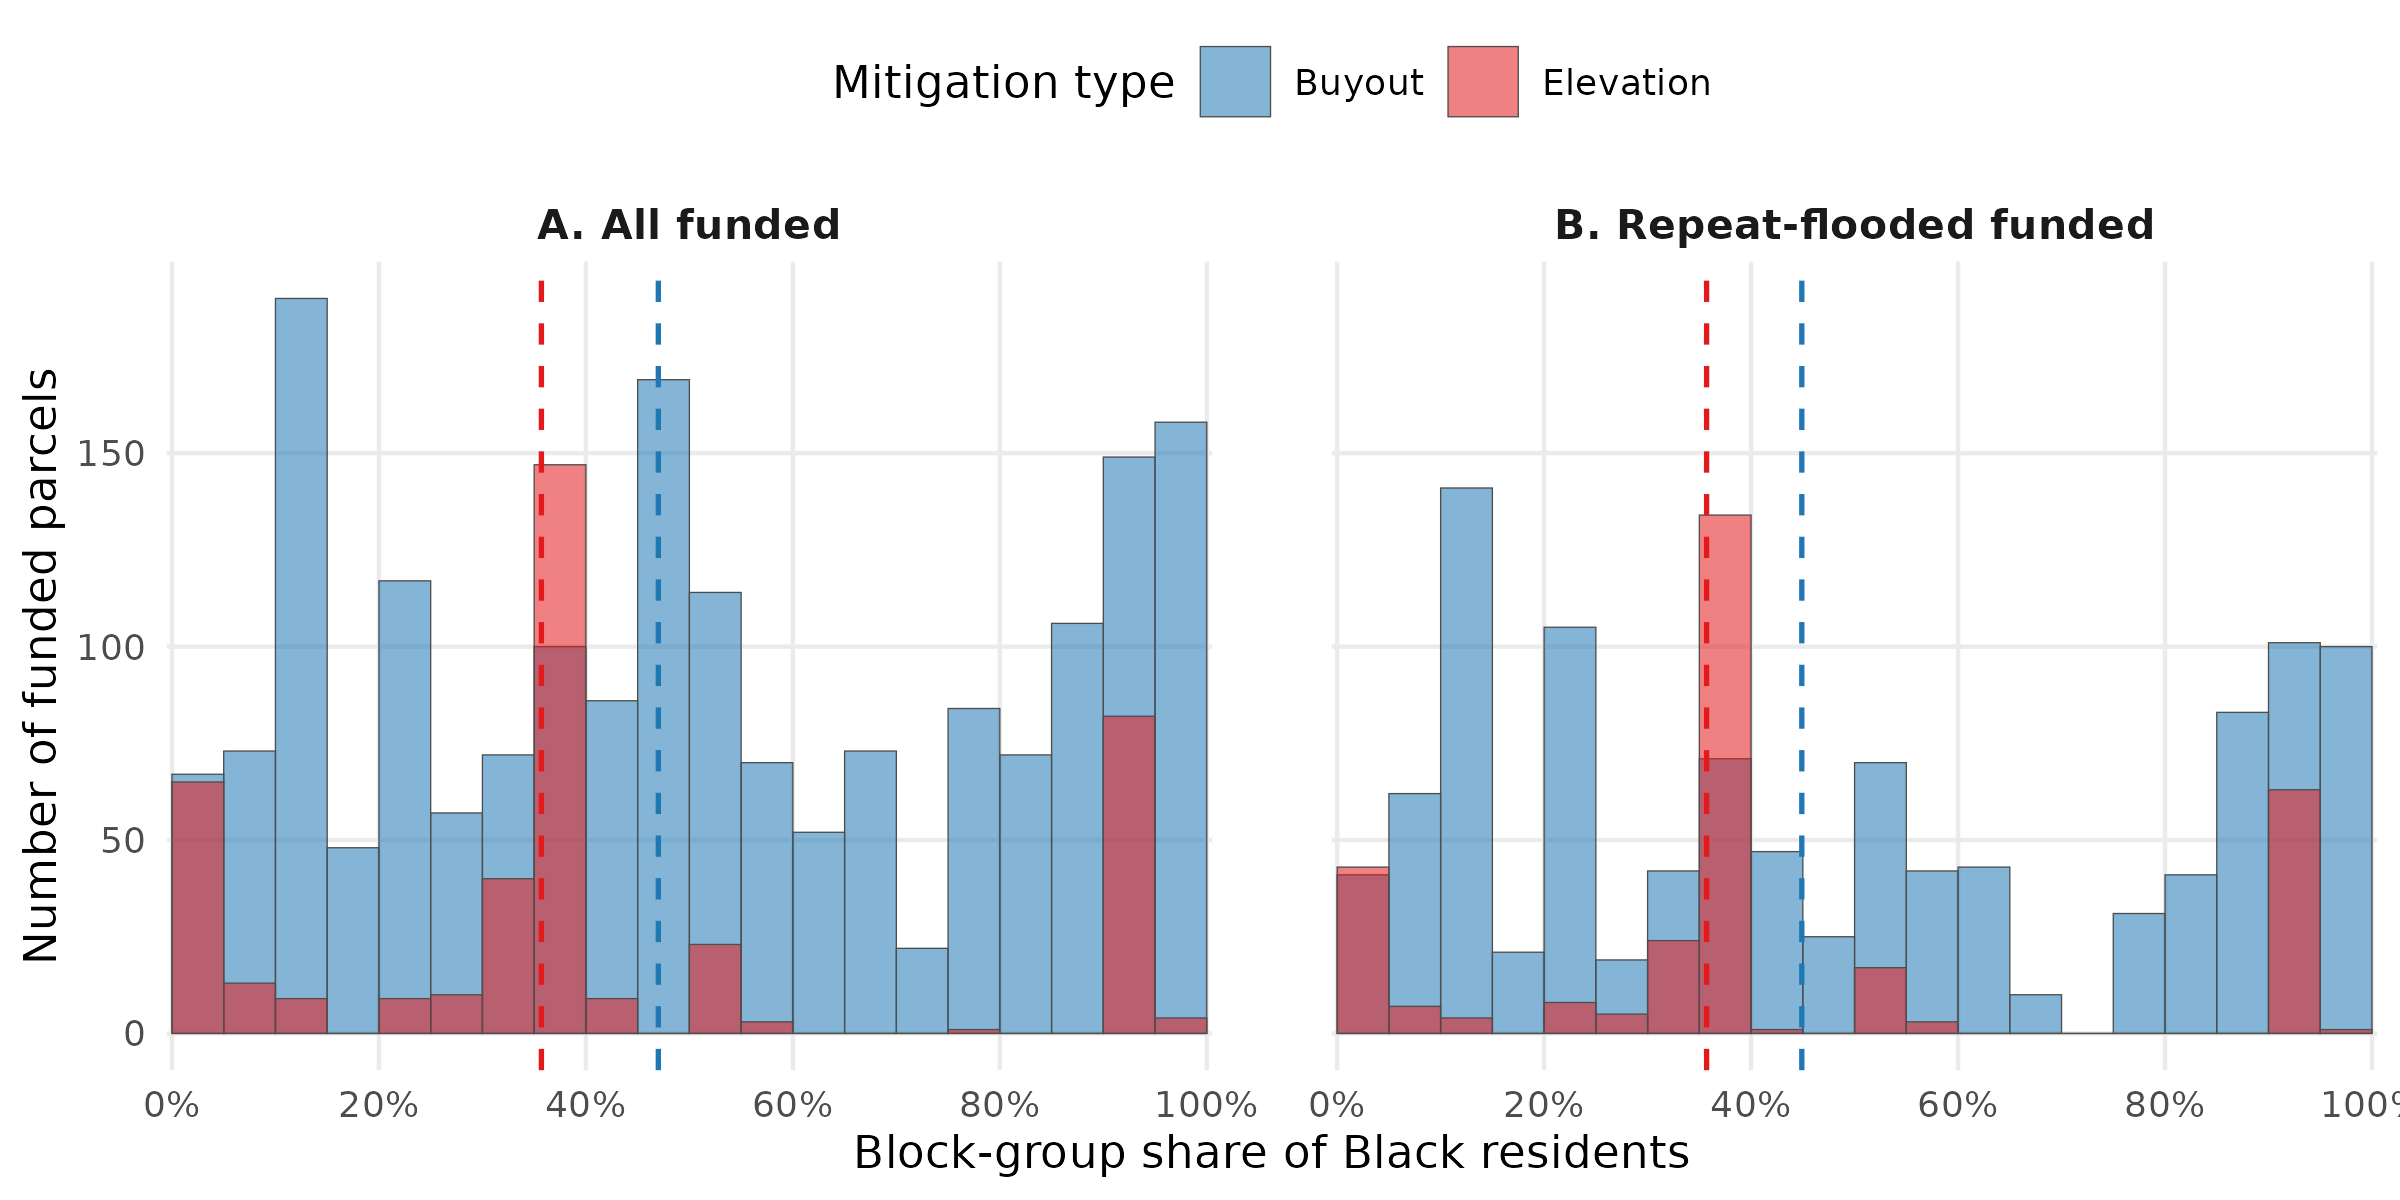
The racial composition of funded parcels differs substantially by mitigation type (Figure 6), which contributes to the funded-stage shift documented in Figure 5. Among funded parcels with a classified project type, buyouts outnumber elevations by approximately 4:1 (1,879 buyouts vs 415 elevations). Buyouts sit in block groups with substantially higher shares of Black residents than elevations (median 47% versus 35.7%; Kolmogorov–Smirnov D = 0.366, p < 0.001). By contrast, the two types occupy similarly valued properties — their property-value distributions largely overlap (median 20th versus 25.7th percentile; D = 0.141, p < 0.001). The buyout–elevation difference in racial composition also holds among repeat-flooded funded parcels (D = 0.32), so it is not confined to once-flooded properties. Because roughly one-third of funded parcels have project types we could not classify, we cannot fully attribute the Figure 5 shift to either mechanism, but buyouts’ higher prevalence and their concentration in less-white neighborhoods suggest they are a meaningful contributor.
Figure 6: The racial-composition shift at the funded stage is driven by buyouts. Distributions of (A) study-area property-value percentile rank and (B) block-group share of Black residents, comparing funded parcels classified as buyouts (blue) and elevations (red); dashed vertical lines mark each group’s median. Within each panel, a two-sample Kolmogorov–Smirnov test compares the buyout and elevation distributions, where D is the maximum distance between their cumulative distributions (0 = identical, 1 = fully separated). Buyouts and elevations differ sharply in neighborhood Black share (Panel B: D = 0.366, p < 0.001) but overlap in property value (Panel A: D = 0.141, p < 0.001). Funded parcels without a recorded project-type classification (approximately one-third of the funded set) are excluded.
Discussion
Our analysis identifies the application stage as the critical pinch point in the flooded-to-funded HMA pipeline. Of all flooded residential properties in eastern North Carolina, only 2.8% apply for funding, and of those, 59.7% receive an award. By tracking the full population of flooded properties rather than only those that received funding, we identify a substantial population of households — to our knowledge not previously quantified at the property scale — that would benefit from mitigation assistance but never enter the applicant pool. This unrealized demand suggests that interventions targeting the application stage may do more to expand the reach of funding to flooded households than refining the selection criteria applied to the small pool of existing applicants.
Many of these non-applying properties have flooded repeatedly. Because repeatedly flooded properties carry higher expected avoided losses — and thus more readily clear federal benefit-cost thresholds — yet are funded at no higher a rate than other applicants, directing outreach toward these households could raise the average cost-effectiveness of the funded portfolio, which refining selection among existing applicants cannot achieve. Fully capturing the unmet demand we document, however, would require additional mitigation appropriations rather than reallocation of a fixed budget, since demand already exceeds available funding.
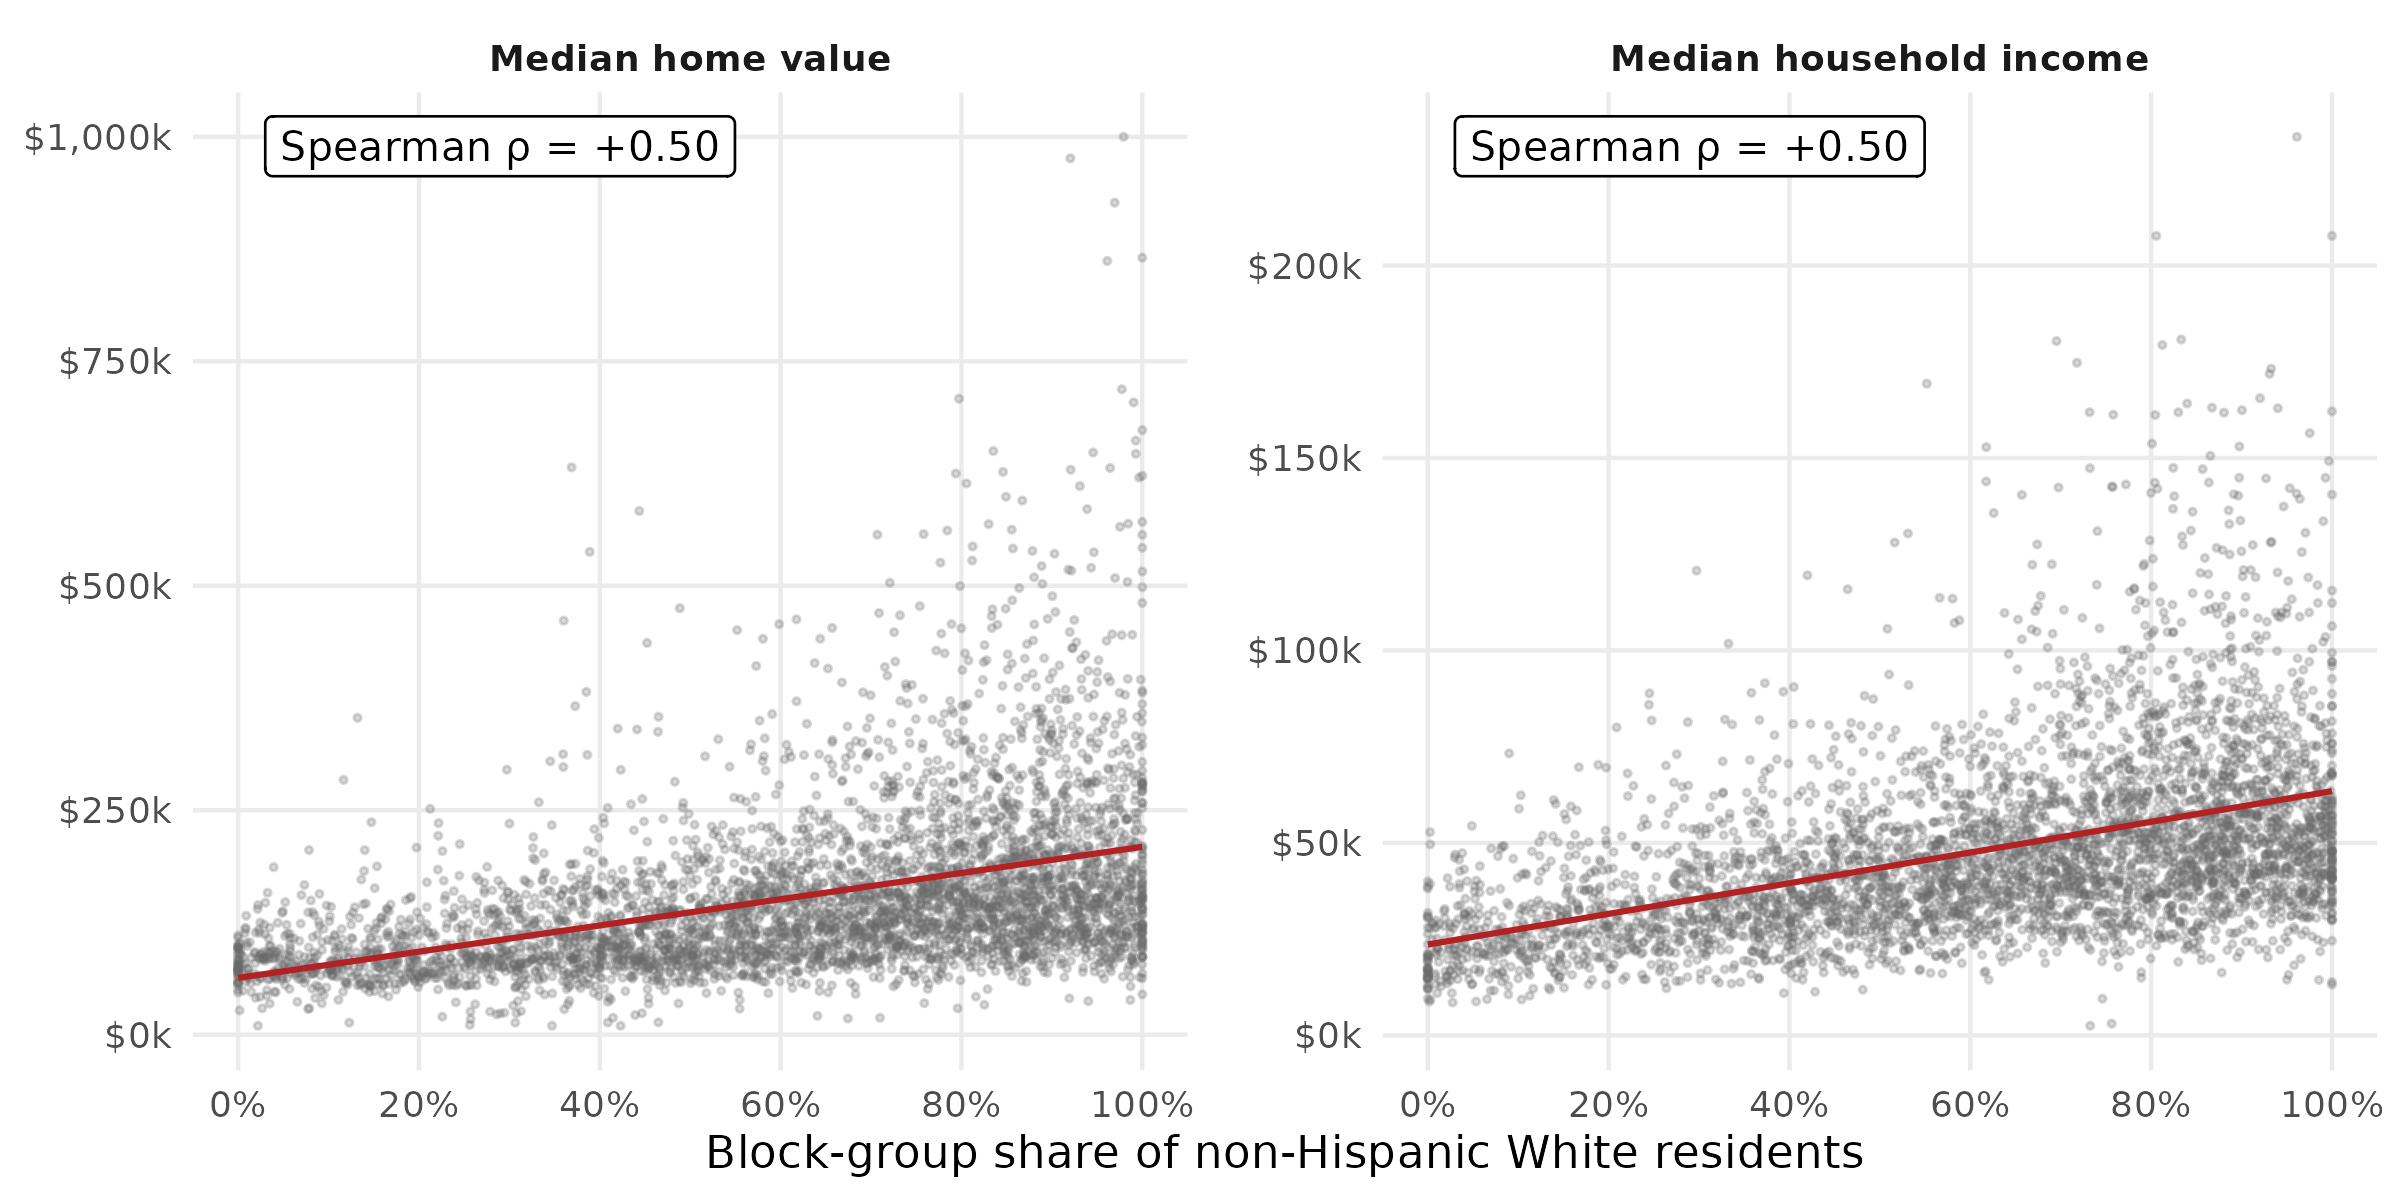
Among the small fraction of properties that receive funding, the composition shifts toward lower-value, less-white neighborhoods. Relative to the flooded stage, funded properties fall at the 23rd percentile of the study-area property-value distribution (from the 51st), sit in block groups with a median non-Hispanic white share of 60% (from 69.3%) and a median Black share of 26.1% (from 16.4%). This shift occurs primarily between neighborhoods rather than within them: within-block-group percentiles for funded properties differ only modestly from those at the flooded stage. The racial shift likely tracks the value shift through the strong correlation between race and property value in eastern North Carolina, where less-white neighborhoods tend to be lower-value (Figure 10). This neighborhood-scale pattern aligns with prior work (Mach et al. 2019; Elliott, Brown, and Loughran 2020), which finds that within whiter, wealthier counties funding concentrates in lower-value, less-white neighborhoods; because we do not conduct an analogous county-level comparison, our results speak to this within-county scale rather than the county-scale pattern those studies also document.
That funding reaches these lower-value, less-white neighborhoods indicates applicants from them are not disadvantaged at the selection stage — the inequity we identify arises earlier, at application. Whether the shift is itself equitable is a separate question, however, particularly for buyouts, where funding concentrated in lower-income, less-white neighborhoods may reflect the disproportionate relocation of marginalized residents rather than an equitable distribution of benefit.
Repeat-flooded properties apply at roughly twice the rate of once-flooded properties but are funded at similar rates. This pattern suggests that flood-exposure history influences application behavior more than selection outcomes, and points to an underused targeting lever for HMA prioritization. HMGP, which dominates HMA funding in our study area, becomes available event-by-event following PDDs and weights damage from a single event heavily in the cost-benefit calculation. Mitigation programs that weighted cumulative flood history over single-event severity would concentrate funding where expected avoided losses, and thus cost-effectiveness, are greatest.
Decomposing the funded set by mitigation type shows that the racial-composition shift at the funded stage is a buyout phenomenon (Figure 6). Buyouts sit in block groups with a substantially higher median Black share than elevations (47% vs. 35.7%; KS D = 0.366, p < 0.001; Figure 6, Panel B). By contrast, the property-value distributions of buyouts and elevations largely overlap (D = 0.141, p < 0.001), so the property-value shift across the pipeline reflects a neighborhood-scale selection process affecting both mitigation types similarly, whereas the racial-composition shift is buyout-specific. This parcel-scale, within-neighborhood pattern extends prior county-scale findings of demographic differences between buyout and elevation targeting (Mach et al. 2019; Elliott, Brown, and Loughran 2020; Frank 2022). The gap is not confined to once-flooded properties: among repeat-flooded funded parcels, buyouts still fall in markedly more-Black block groups than elevations (D = 0.32, p < 0.001), consistent with a systematic difference in how the two programs are sited.
Our cross-sectional data also let us rule out several candidate mechanisms for the equity patterns we observe. If the federal CBA requirement were primarily driving selection toward higher-value properties, we would expect funded properties to be concentrated at higher property values; instead, we see the opposite, and many lower-value properties apply. This holds within neighborhoods as well where funded properties sit only slightly above their block-group median (~60th percentile, roughly the same position they occupy at the flooded stage) so funding shows no tendency to select higher-value homes even within a given neighborhood. Because CBA is a federal rule applied uniformly across states, this pattern should generalize beyond North Carolina. Community participation is not the binding constraint in our study area: 65.6% of flooded properties sit in jurisdictions with at least one HMA application, yet only 2.8% apply themselves. The sharp attrition occurs at the individual application stage, not the community stage. This likely differs in states without North Carolina’s state-level cost-share absorption, where community participation may itself be a larger barrier. We also see no evidence of applicant pools dominated by high-value properties, which would be consistent with local governments selectively recruiting wealthier households for application support, though this pattern may be specific to North Carolina and could differ in states with different local capacity or outreach practices. Together, these patterns suggest that the concentration of funding in lower-value, less-white communities is determined primarily at the application stage — where the median shift toward these communities is largest — rather than by selection within the applicant pool, where the applied-to-funded shift is comparatively modest. In other words, the pattern appears to be a function of who applies, and who is solicited to apply, more than which applications are chosen. Disentangling whether this reflects differential outreach, programmatic preferences for buyout siting, or other mechanisms is an important direction for future work.
Several methodological limitations apply. First, our flood-exposure data come from a reconstruction of 78 flood events in eastern North Carolina between 1996 and 2020 (Garcia et al. 2025). The underlying models are conservative and likely underestimate the true population of flood-exposed properties. A sensitivity analysis dropping the seven events Garcia et al. flag for unusually high modeled-to-observed damage ratios produces materially identical headline findings: the number of funded parcels changes by only 2.3%, and median demographic compositions move by less than half a percentage point (Supplementary Materials). Second, our data on the timing of applications and mitigations is incomplete, so we do not distinguish between floods that occur before or after a property is funded for mitigation. This is particularly relevant for our repeat-flood analysis: properties that were elevated or bought out before a subsequent modeled flood event may appear in our data as repeat-flooded even though the structure may no longer have been exposed or may have been physically removed. Because we do not observe the date on which each buyout or elevation was completed, we cannot determine when a property entered its mitigated state; rather than drop these properties on the basis of assumptions, we conservatively retain them throughout the sample. Because these cases require a property to have already been funded for mitigation, they should be concentrated in the funded stage and are unlikely to be numerous; they would, if anything, modestly overstate the funding rate among repeat-flooded properties rather than change our central conclusion that repeat-flooded properties apply at higher rates but are funded at similar rates to once-flooded properties. Third, approximately one third of funded mitigation records lack a project-type classification, so our buyout-versus-elevation comparison (Figure 6) is restricted to the classified subset. We cannot observe whether these unclassified records skew toward buyouts or elevations; on the attributes we do observe, however, they closely resemble the classified records (median value percentile 27.5 vs. 21; median block-group Black share 34% vs. 47%), suggesting the missing classifications are not strongly systematic along the dimensions central to our findings. We nonetheless cannot rule out differences by mitigation type itself, which we do not observe. Fourth, our block-group demographic data come from the 2013 American Community Survey, which falls near the midpoint of the study window but does not capture demographic changes over the full 1996–2020 period. Finally, while we document more of the application process than past studies, there are still many aspects that we do not observe, such as how local governments approach (or fail to approach) flooded households about funding opportunities, procedural obstacles that may deter applications from interested households, and sources of non-governmental assistance.
A broader interpretive caveat concerns what our findings imply for affected households. Federal mitigation funding flows disproportionately to lower-value, less-white block groups relative to the broader flood-exposed population, a pattern consistent with mitigation reaching historically underserved communities in North Carolina. Whether participation actually serves these households, however, requires post-mitigation outcome data we do not have; this is particularly relevant for buyouts, where prior research has questioned whether participation reflects informed preference or limited alternatives (Mach et al. 2019). Within block groups, funded properties sit slightly above the local median rather than being the lowest-value homes, so the compositional shift we observe is driven largely by upstream pipeline stages — community participation, application rates, and the spatial distribution of flood exposure itself — rather than by the within-neighborhood selection of which properties are ultimately funded. We do not observe within-neighborhood racial shifts directly, since racial composition is measured only at the block-group level; however, the stability of within-neighborhood property-value percentiles across pipeline stages, together with the strong neighborhood-scale correlation between race and property value, gives us some basis to infer that little within-neighborhood racial selection occurs. Procedural neutrality at any one step is not sufficient to establish that the cumulative distribution of funding is substantively equitable.
Conclusions
This study follows individual residential properties from flood exposure through mitigation funding outcome at each significant stage, including the previously unobserved application stage. The largest falloff in the pipeline occurs at the application step, and properties that reach subsequent stages tend to be lower-value and located in less-white neighborhoods. For property value, this shift operates primarily between neighborhoods rather than within them; because racial composition is measured only at the block-group level, the racial shift is necessarily a between-neighborhood pattern, and within-neighborhood racial selection is something we cannot observe. These results identify two leverage points that prior work — focused on funded outcomes alone — could not observe. The first is the application stage: expanding who applies would broaden access to federal mitigation funding. The second lies in the funding decision itself, where repeatedly flooded applicants are funded at no higher a rate than once-flooded applicants despite their higher expected avoided losses; reweighting cost-benefit criteria toward cumulative flood history offers a concrete, lower-cost way to align funding with risk.
These findings arrive amid significant federal restructuring of hazard mitigation policy. The FEMA Review Council’s May 2026 final report recommended replacing HMGP with a state-managed Refined Risk Reduction Program that would prioritize repetitively flooded properties and acknowledged administrative burdens that may discourage applications from under-resourced communities (President’s Council to Assess the Federal Emergency Management Agency 2026). The application-stage attrition we document is consistent with those concerns. Reforms targeting funding-side changes such as disbursement speed, federal priority-setting, or program structure will require complementary attention to application-stage barriers if they are to translate into broader access. Future research could extend this approach to community-scale infrastructure investments such as stormwater system upgrades and BRIC community projects, which may also reduce household-level flood risk through complementary pathways.
Methods
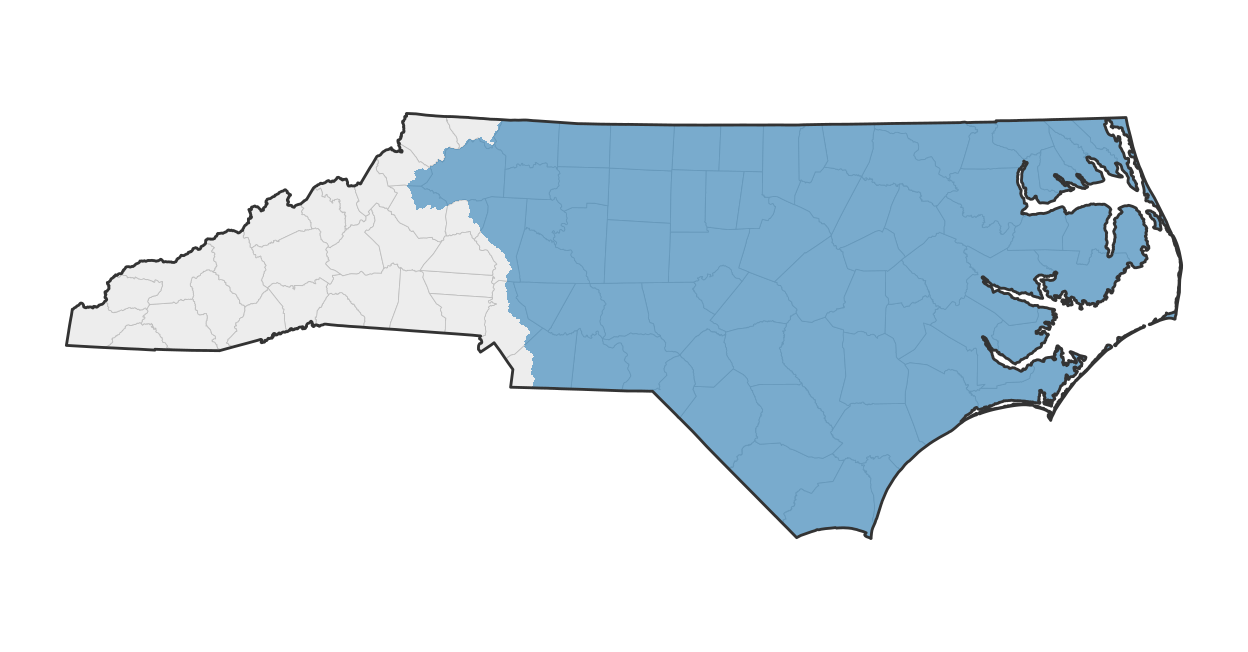
We assemble over 20 years of data on flood exposure, applications for state and federal funding, and funding allocations. Flood exposure data are generated using a random forest model trained on address-level records of National Flood Insurance Program (NFIP) policies-in-force and claims filed from January 1996 through September 2020, obtained from FEMA Region IV (Garcia et al. 2025). The model domain encompasses the entirety of the Neuse–Pamlico and Cape Fear watersheds and portions of the Pee Dee and Chowan–Roanoke watersheds that drain through eastern North Carolina, overlapping with 78 of North Carolina’s 100 counties (Figure 7). This measure indicates whether a parcel intersected the modeled footprint of an event but does not capture the severity of any individual exposure; some properties classified as flooded may have experienced relatively minor inundation. We link these flood exposure data to parcel geometries from the North Carolina OneMap database, attribute records from the CoreLogic property database, application and funding records from the North Carolina Department of Public Safety (NCDPS), and block-group demographic data from the American Community Survey (ACS).
In [2]:
library(sf)
Linking to GEOS 3.12.0, GDAL 3.11.0, PROJ 9.2.1; sf_use_s2() is TRUE
library(dplyr)library(ggplot2)library(tigris)
To enable caching of data, set `options(tigris_use_cache = TRUE)`
in your R script or .Rprofile.
options(tigris_use_cache =TRUE)crs_nc <-32119# NC State Plane (meters); equal-area enough for a state-scale figure# --- Study-area domain (HUC6 union) ---study_area_path <-"/proj/mhinolab/projects/obstacles/NC_huc6_data_union_sf/NC_huc6_data_union_sf.shp"study_area <-st_read(study_area_path, quiet =TRUE) |>st_make_valid() |>st_union() |>st_transform(crs_nc)# --- NC boundaries ---nc_counties <-counties(state ="NC", cb =TRUE, year =2021, progress_bar =FALSE) |>st_transform(crs_nc)nc_state <-st_union(nc_counties) |>st_make_valid()# Clip domain to NC for a clean edge and an honest area sharestudy_in_nc <-st_intersection(study_area, nc_state) |>st_make_valid()# Stats for the caption/subtitlen_in <-sum(lengths(st_intersects(nc_counties, study_in_nc)) >0)pct_area <-as.numeric(st_area(study_in_nc)) /as.numeric(st_area(nc_state)) *100ggplot() +geom_sf(data = nc_counties, fill ="grey93", color ="grey75", linewidth =0.15) +geom_sf(data = study_in_nc, fill ="#2c7fb8", color =NA, alpha =0.60) +geom_sf(data = nc_state, fill =NA, color ="grey20", linewidth =0.5) +theme_void(base_size =10) +theme(plot.subtitle =element_text(hjust =0.5, size =9),plot.margin =margin(4, 4, 4, 4))
Figure 7: Study-area domain within North Carolina. The shaded region shows the model domain (the union of the Neuse–Pamlico and Cape Fear watersheds and the portions of the Pee Dee and Chowan–Roanoke watersheds draining through eastern North Carolina); unshaded counties fall outside the domain. County boundaries are shown for reference.
We use this combined dataset to track residential properties through four sequential stages of the flood mitigation funding pipeline (Figure 2): whether a property has flooded, whether its local government has applied for funding, whether the property itself is named on an application, and whether that application was funded.
Unit of analysis
The base unit of analysis is the residential parcel. Parcel geometries come from the North Carolina OneMap database, which aggregates county tax assessor records into a statewide spatial layer, and each parcel is labeled with property-level information (land use code, structure characteristics, assessor value) from the CoreLogic property database. Where parcel records and CoreLogic records share a common identifier we match directly; the remaining parcels are matched spatially, with address-string similarity used to break ties when more than one CoreLogic record is closest. We retain 1–4 family residential parcels and exclude commercial, industrial, agricultural, and most government-owned land uses. A small number of residential parcels are recorded in CoreLogic as currently vacant or government-owned. Because completed buyouts demolish the structure and transfer the parcel to public ownership, these post-buyout parcels appear in the present-day data with property values that reflect their post-mitigation rather than pre-mitigation state. To recover a pre-mitigation value for parcels that we have reason to believe were previously residential, we impute the property value as the mean assessor value of the five nearest non-vacant residential parcels. Parcels that are vacant for reasons unrelated to mitigation are excluded from the property-value analysis. The final analytic sample comprises 3,137,520 parcels.
Flooded-to-funded pipeline stages
Flood exposure is constructed at the parcel level using the inundation footprints generated by Garcia et al. (2025), which resolve individual flood events on a 30 m × 30 m grid. Garcia et al. identify discrete flood events by detecting temporal clusters of NFIP claims: an event is defined as at least 15 claims recorded within a 7-day window in a single USGS HUC-6 watershed (Garcia et al. 2025). This procedure yields 78 events between January 1996 and September 2020, which together account for 67,259 claims — 95% of all NFIP claims filed in the study area over the period. We use all 78. A parcel is classified as flooded if its geometry intersects the footprint of at least one of these 78 events. This property-resolved flood history serves as the reference set against which subsequent pipeline stages are measured, enabling the first parcel-level linkage between flood exposure and federal mitigation outcomes in the region.
Application and funding records cover two FEMA Hazard Mitigation Assistance (HMA) programs administered by NCDPS: the Hazard Mitigation Grant Program (HMGP), which becomes available following presidential disaster declarations (PDDs) issued event-by-event and county-by-county; and Flood Mitigation Assistance (FMA), which depends on a property’s NFIP claim and policy history rather than on a PDD. FMA encompasses the repetitive-loss pathways previously administered under the standalone Repetitive Flood Claims (RFC) and Severe Repetitive Loss (SRL) programs before their consolidation into FMA in FY2014. Of the 78 events in our flood-exposure dataset, 18 triggered PDDs that included at least one North Carolina county; these constitute the universe of disaster declarations from which HMGP funding could flow during our study period.
NCDPS provided address-level records of every project submitted for HMA funding under HMGP and FMA, along with the subset of those projects that were ultimately funded. Application records (n = 23,232) and funded mitigation records (n = 8,801) span 1996 through 2018, encompassing major North Carolina disaster events including Hurricanes Fran (1996), Floyd (1999), Isabel (2003), Irene (2011), Matthew (2016), and Florence (2018). Hurricane Floyd dominates the funded record, accounting for 58% of mitigations with a recorded disaster year.
The HMA application process is administered through local governments. Households cannot apply directly to FEMA: instead, a county or municipal government compiles project documentation (including the cost-benefit analysis, NFIP claim records, and deed and title records) and submits applications on behalf of interested homeowners, often with state-level coordination from NCDPS. Local governments differ substantially in their willingness and capacity to do this work (Mach et al. 2019; Junod et al. 2021). To capture this community-level filter, we assign every parcel to its containing municipality, or to its containing county where no municipality exists, and classify each jurisdiction by whether it submitted at least one HMA application during the study period. Within applying jurisdictions, we then geocode application and funding records back to OneMap parcels and classify each property as never applied, applied but not funded, or applied and funded.
Pipeline analysis
Property values are taken from the 2022 CoreLogic vintage and used at the parcel level. We express each property’s value as a percentile rank across all 1–4 family residential parcels in the study area, using relative rather than absolute property value as our primary property-value measure throughout the analysis. To complement the broad ranking, we also compute each property’s value as a percentile rank within its own census block group. This within-neighborhood percentile lets us test whether selection toward lower-value properties occurs within neighborhoods or primarily reflects selection toward lower-value neighborhoods.
Neighborhood-level race and income data are obtained at the census block-group scale and joined to each parcel based on its containing block group. We use the 2013 vintage of the American Community Survey because it falls near the midpoint of our 1996–2020 flood-exposure window. The 18 disaster declarations represented in our study area span this period, with the earliest being Hurricane Bertha (1996) and the most recent being Hurricane Isaias (2020). Block-group variables include the share of residents identifying as non-Hispanic white, the share identifying as non-Hispanic Black, and median household income. We aggregate parcel-level results to the block group when reporting demographic-composition shifts across pipeline stages.
The four-stage pipeline is a sequence of nested subsets: each stage is, by construction, a subset of the previous one. We characterize each stage in two ways. First, we count the number of parcels that survive into the stage and report stage-to-stage attrition rates for both once-flooded parcels and parcels that flooded two or more times (i.e., repeatedly flooded parcels). Our flood-exposure measure captures only the number of events a parcel intersected, not the severity (such as depth, duration, or damage) of any individual exposure. Second, we describe the distribution of property values (study area wide percentile rank) and block-group demographics at each stage, to identify where in the pipeline shifts in wealth and racial composition emerge. To test whether the property-value and neighborhood racial-composition distributions shift across the pipeline, we compare the funded stage against the flooded baseline using two-sample Kolmogorov–Smirnov (KS) tests. The KS test statistic D is the maximum absolute difference between the two groups’ empirical cumulative distribution functions, ranging from 0 (identical distributions) to 1 (no overlap); it captures the overall difference in distributional shape rather than a difference in means or medians. Property-value tests are conducted at the parcel level on both the study-area percentile and the within-block-group percentile, the latter restricted to block groups containing at least five residential parcels; racial-composition tests are conducted at the block-group level, with one observation per block group reaching each stage. Because the pipeline stages are nested subsets rather than independent samples, we interpret these tests as descriptive comparisons of distributional shape rather than as formal statistical inference.
This cross-sectional design intentionally treats the pipeline as a series of selection filters. By observing applications, funding, and flood exposure at the parcel level for every residential property in the study area, we identify the transitions at which the composition of the surviving population shifts — in flood exposure, property value, and neighborhood demographics — rather than inferring these shifts from funded properties alone.
Mitigation type classification
To examine whether the wealth and racial-composition shifts we observe at the funded stage differ between buyouts and elevations, we classify each funded mitigation record by mitigation type. NCDPS records distinguish acquisitions (in which a property is purchased and the structure demolished, requiring household relocation) from elevations (in which the existing structure is raised above the flood level, preserving in-place residence). We classify parcels with at least one acquisition record as buyouts, parcels with at least one elevation record (but no acquisition) as elevations, and the remainder — including Utility Infrastructure, Quick Connect, and records with no mitigation type specified — as Other/Unknown. Approximately one third of funded parcels fall into the Other/Unknown category, and the comparison below is restricted to the classified subset of 2,294 parcels.
Acknowledgments
This material is based upon work supported by the U.S. Department of Homeland Security under Grant Award Number 2015-ST-061-ND0001-01, and by the National Oceanic and Atmospheric Administration (NOAA) Climate Program Office Regional Integrated Sciences and Assessments program [NA21OAR4310312].
We thank the North Carolina Department of Public Safety for providing application and funding records, and Helen Klass-Warch for her work on the mitigation and application data assignments.
The views and conclusions contained herein are those of the authors and should not be interpreted as necessarily representing the official policies, either expressed or implied, of the U.S Department of Homeland Security or NOAA. NOAA had no role in the design or conduct of the study; data analysis or interpretation; preparation, review, or approval of the manuscript; or decision to submit the manuscript for publication.
References
Bento, Asia, and James R. Elliott. 2022. “The RaciallyUnequalImpacts of Disasters and FederalRecoveryAssistance on LocalSelf-EmploymentRates.”Social Currents 9 (5): 424–44. https://doi.org/10.1177/23294965211028841.
Binder, Sherri Brokopp, Charlene K. Baker, Liesel A. Ritchie, John P. Barile, and Alex Greer. 2023. “‘Upheaval’: Unpacking the Dynamic Balance Between Place Attachment and Social Capital in Disaster Recovery.”American Journal of Community Psychology 72 (3-4): 378–94. https://doi.org/10.1002/ajcp.12697.
Bolin, Robert, and Lois Stanford. 1998. “The NorthridgeEarthquake: Community-Based Approaches to UnmetRecoveryNeeds.”Disasters 22 (1): 21–38. https://doi.org/10.1111/1467-7717.00073.
Bubeck, Philip, Willem Jan Wouter Botzen, and Jeroen CJH Aerts. 2012. “A Review of Risk Perceptions and Other Factors That Influence Flood Mitigation Behavior.”Risk Analysis: An International Journal 32 (9): 1481–95.
Drakes, Olivia, Eric Tate, Janelle Rainey, and Samuel Brody. 2021. “Social Vulnerability and Short-TermDisasterAssistance in the UnitedStates.”International Journal of Disaster Risk Reduction 53: 102010. https://doi.org/10.1016/j.ijdrr.2020.102010.
Elliott, James R., Phylicia Lee Brown, and Kevin Loughran. 2020. “Racial Inequities in the FederalBuyout of Flood-ProneHomes: ANationwideAssessment of EnvironmentalRisk.”Socius: Sociological Research for a Dynamic World 6: 1–13. https://doi.org/10.1177/2378023120905439.
Emrich, Christopher T., Sadeep K. Aksha, and Yang Zhou. 2022. “Assessing DistributiveInequities in FEMA’s DisasterRecoveryAssistanceFundAllocation.”International Journal of Disaster Risk Reduction 74: 102855. https://doi.org/10.1016/j.ijdrr.2022.102855.
Environmental Information, NOAA National Centers for. 2024. “U.S. Billion-DollarWeather and ClimateDisasters.”https://doi.org/10.25921/stkw-7w73.
Garcia, Helena M., Antonia Sebastian, Kieran P. Fitzmaurice, Miyuki Hino, Elyssa L. Collins, and Gregory W. Characklis. 2025. “Reconstructing RepetitiveFloodExposureAcross 78 EventsFrom 1996 to 2020 in NorthCarolina, USA.”Earth’s Future 13 (7): e2025EF006026. https://doi.org/10.1029/2025EF006026.
Junod, Anne N., Carlos Martín, Rebecca Marx, and Amy Rogin. 2021. “Equitable Investments in Resilience: AReview of Benefit-CostAnalysis in FederalFloodMitigationInfrastructure.” Urban Institute, Metropolitan Housing; Communities Policy Center. https://www.urban.org/research/publication/equitable-investments-resilience.
Kamel, Nabil. 2012. “Social Marginalisation, Federal Assistance and Repopulation Patterns in the New Orleans Metropolitan Area Following Hurricane Katrina.”Urban Studies 49 (14): 3211–31. https://doi.org/10.1177/0042098011433490.
Loughran, Kevin, and James R. Elliott. 2022. “Unequal Retreats: How Racial Segregation Shapes Climate Adaptation.”Housing Policy Debate 32 (1): 171–89. https://doi.org/10.1080/10511482.2021.1931928.
Mach, Katharine J., Caroline M. Kraan, Miyuki Hino, A. R. Siders, Erica M. Johnston, and Christopher B. Field. 2019. “Managed RetreatThroughVoluntaryBuyouts of Flood-ProneProperties.”Science Advances 5 (10): eaax8995. https://doi.org/10.1126/sciadv.aax8995.
Méndez, Michael, Genevieve Flores-Haro, and Lucas Zucker. 2020. “The (in)visible Victims of Disaster: Understanding the Vulnerability of Undocumented Latino/a and Indigenous Immigrants.”Geoforum 116 (November): 50–62. https://doi.org/10.1016/j.geoforum.2020.07.007.
Raker, Ethan J. 2023. “Stratifying Disaster: StateAid, InstitutionalProcesses, and Inequality in AmericanCommunities.”Social Forces 102 (2): 430–53. https://doi.org/10.1093/sf/soad050.
Rivera, Danielle Zoe, Bradleigh Jenkins, and Rebecca Randolph. 2022. “Procedural Vulnerability and ItsEffects on EquitablePost-DisasterRecovery in Low-IncomeCommunities.”Journal of the American Planning Association 88 (2): 220–31. https://doi.org/10.1080/01944363.2021.1929417.
Tate, Eric, M. A. Rahman, and Christopher T. Emrich. 2021. “Flood Exposure and SocialVulnerability in the UnitedStates.”Natural Hazards 106: 435–57. https://doi.org/10.1007/s11069-020-04470-2.
Wilson, Brenda, Eric Tate, and Christopher T. Emrich. 2021. “Flood RecoveryOutcomes and DisasterAssistanceBarriers for VulnerablePopulations.”Frontiers in Water 3: 752307. https://doi.org/10.3389/frwa.2021.752307.
Supplementary Materials
The supplementary materials include additional figures and analyses that support the main-text results. Section S1 presents block-group economic and racial composition across the HMA pipeline. Section S2 documents the correlation between race and economic indicators in the study area. Section S3 provides the full buyout-versus-elevation comparison including the repeat-flooded subset. Section S4 reports a sensitivity analysis that re-runs the full pipeline excluding seven high-uncertainty flood events.
S1. Block-group economic distributions across the HMA pipeline
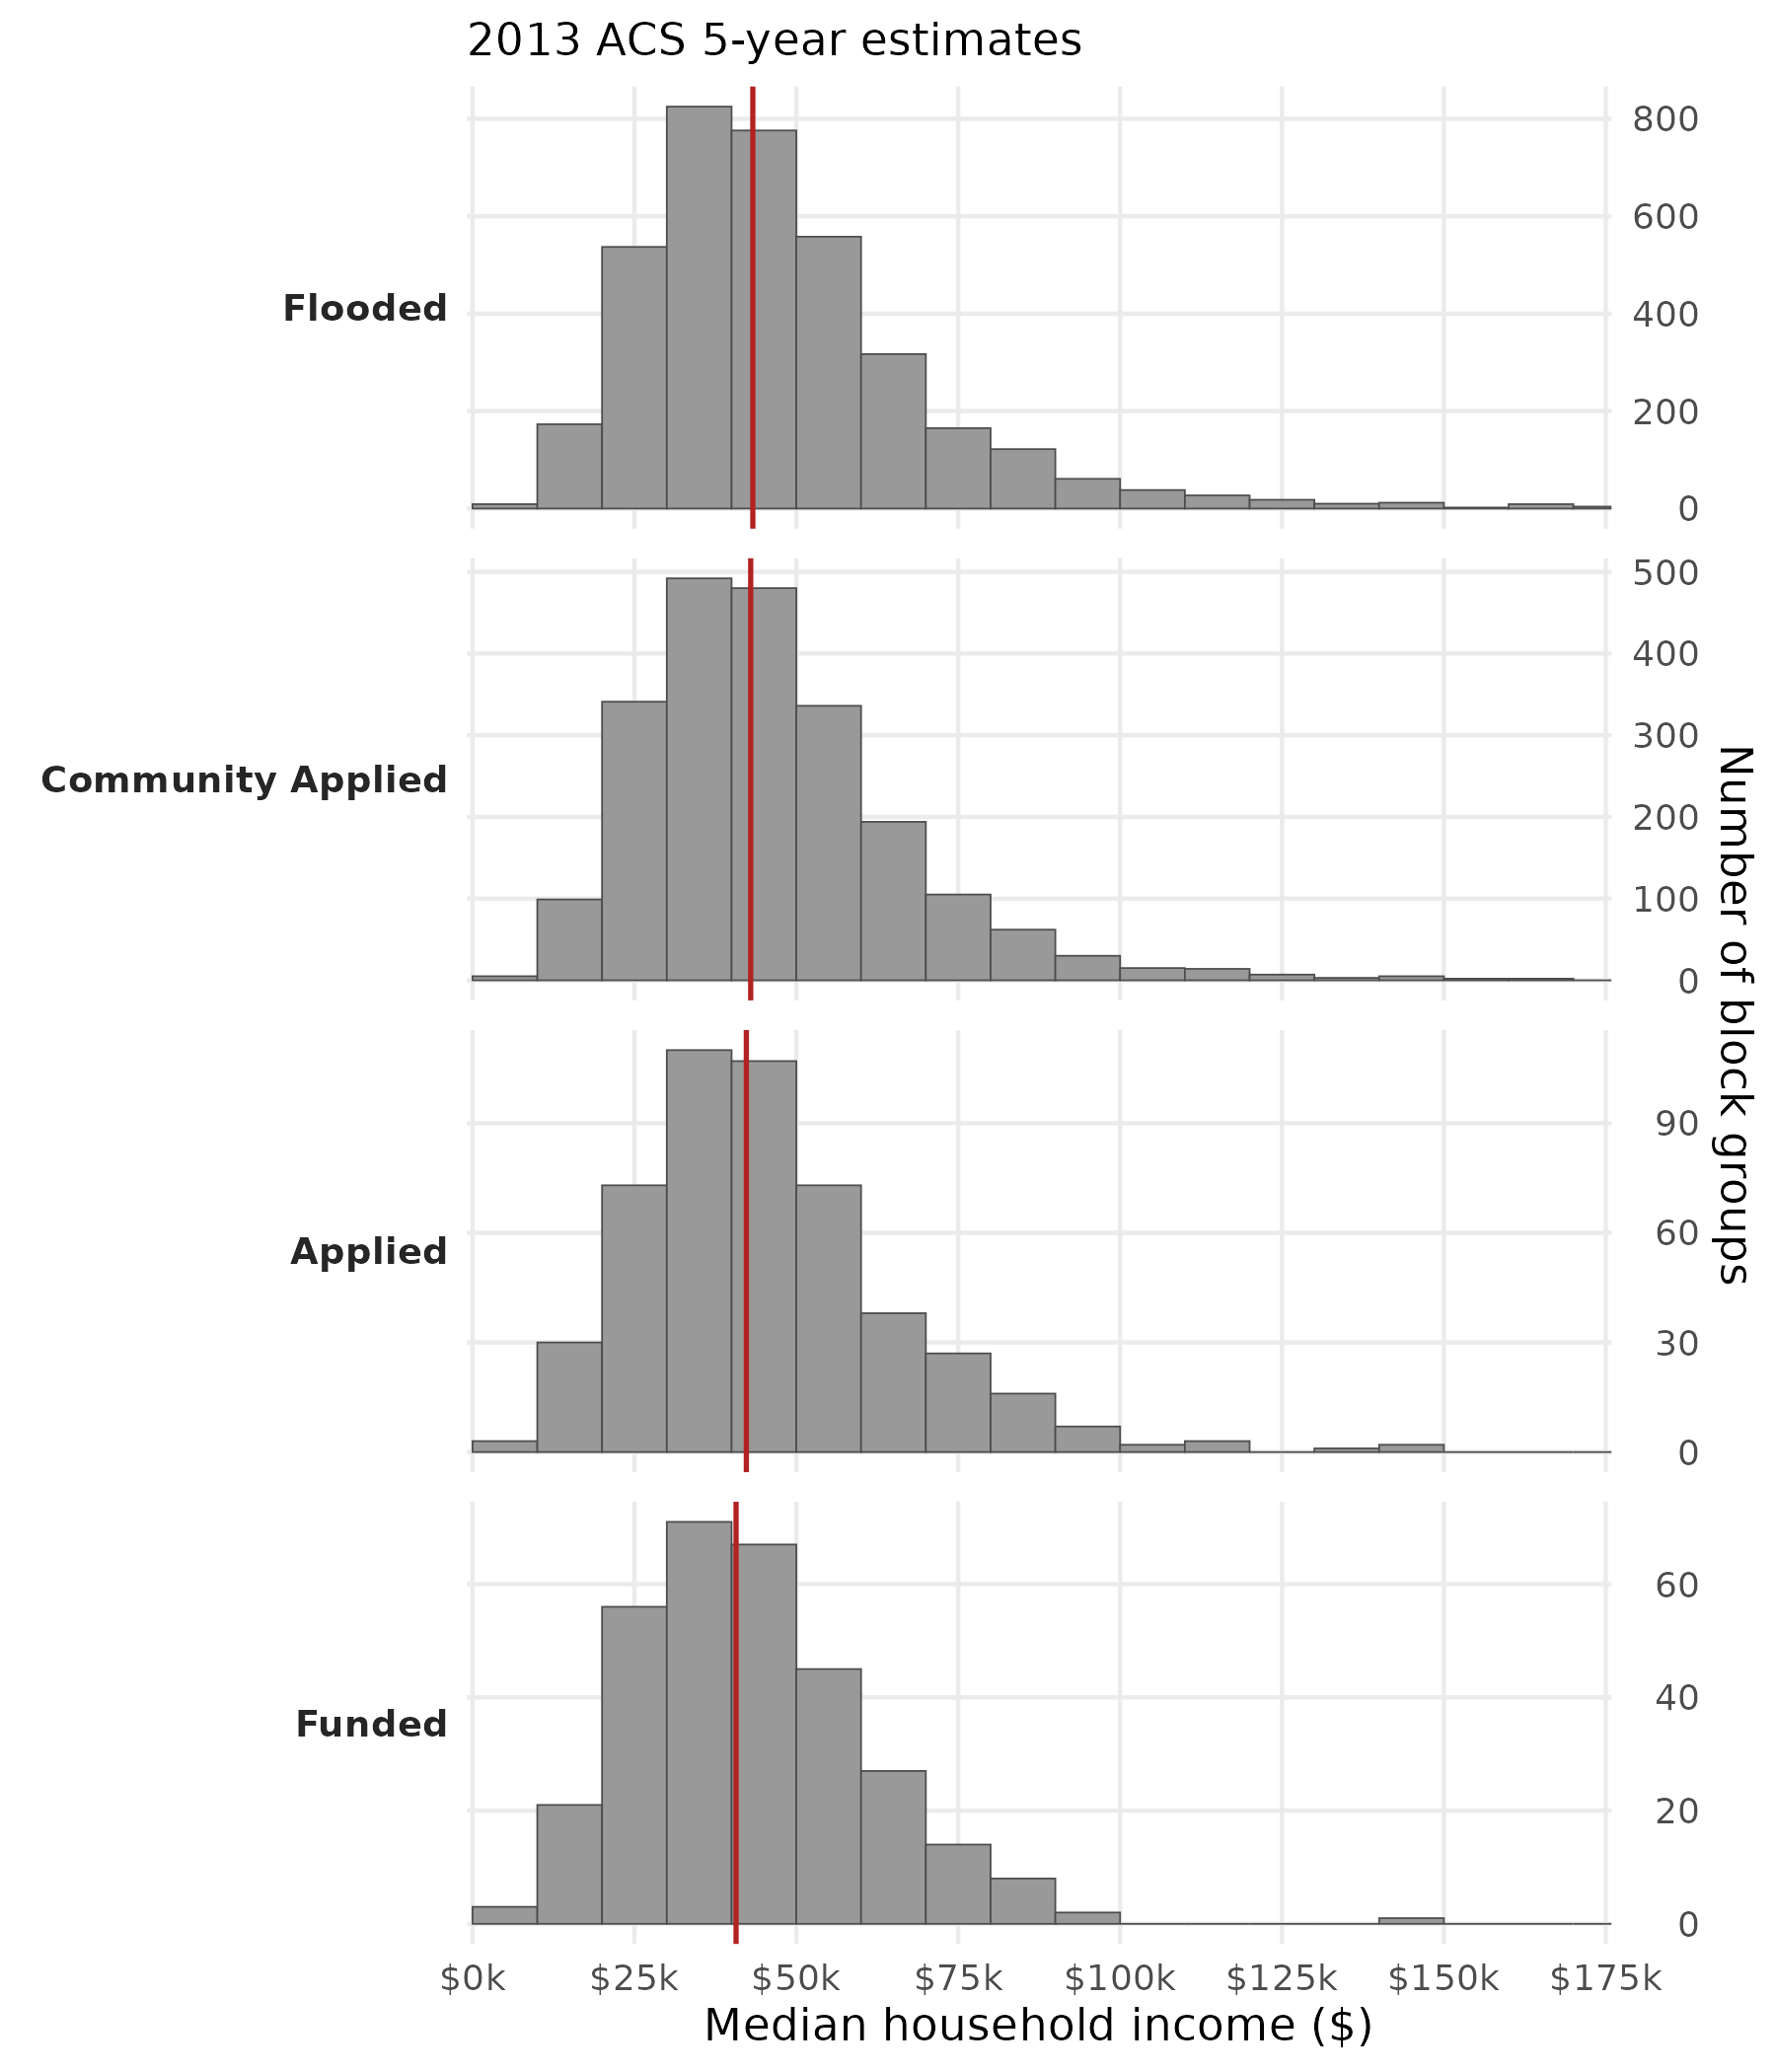
Figure 8: Block-group median household income across the HMA pipeline. Distribution of block-group median household income (2013 ACS 5-year estimates) for block groups containing at least one residential parcel reaching each pipeline stage. Panel A shows all flood-exposed parcels; Panel B is restricted to repeat-flooded parcels (those exposed to more than one of the 78 modeled events). Stages from top to bottom: Flooded, Community Applied, Applied, Funded. Red vertical lines mark stage medians. The x-axis is truncated at $175,000 for readability.
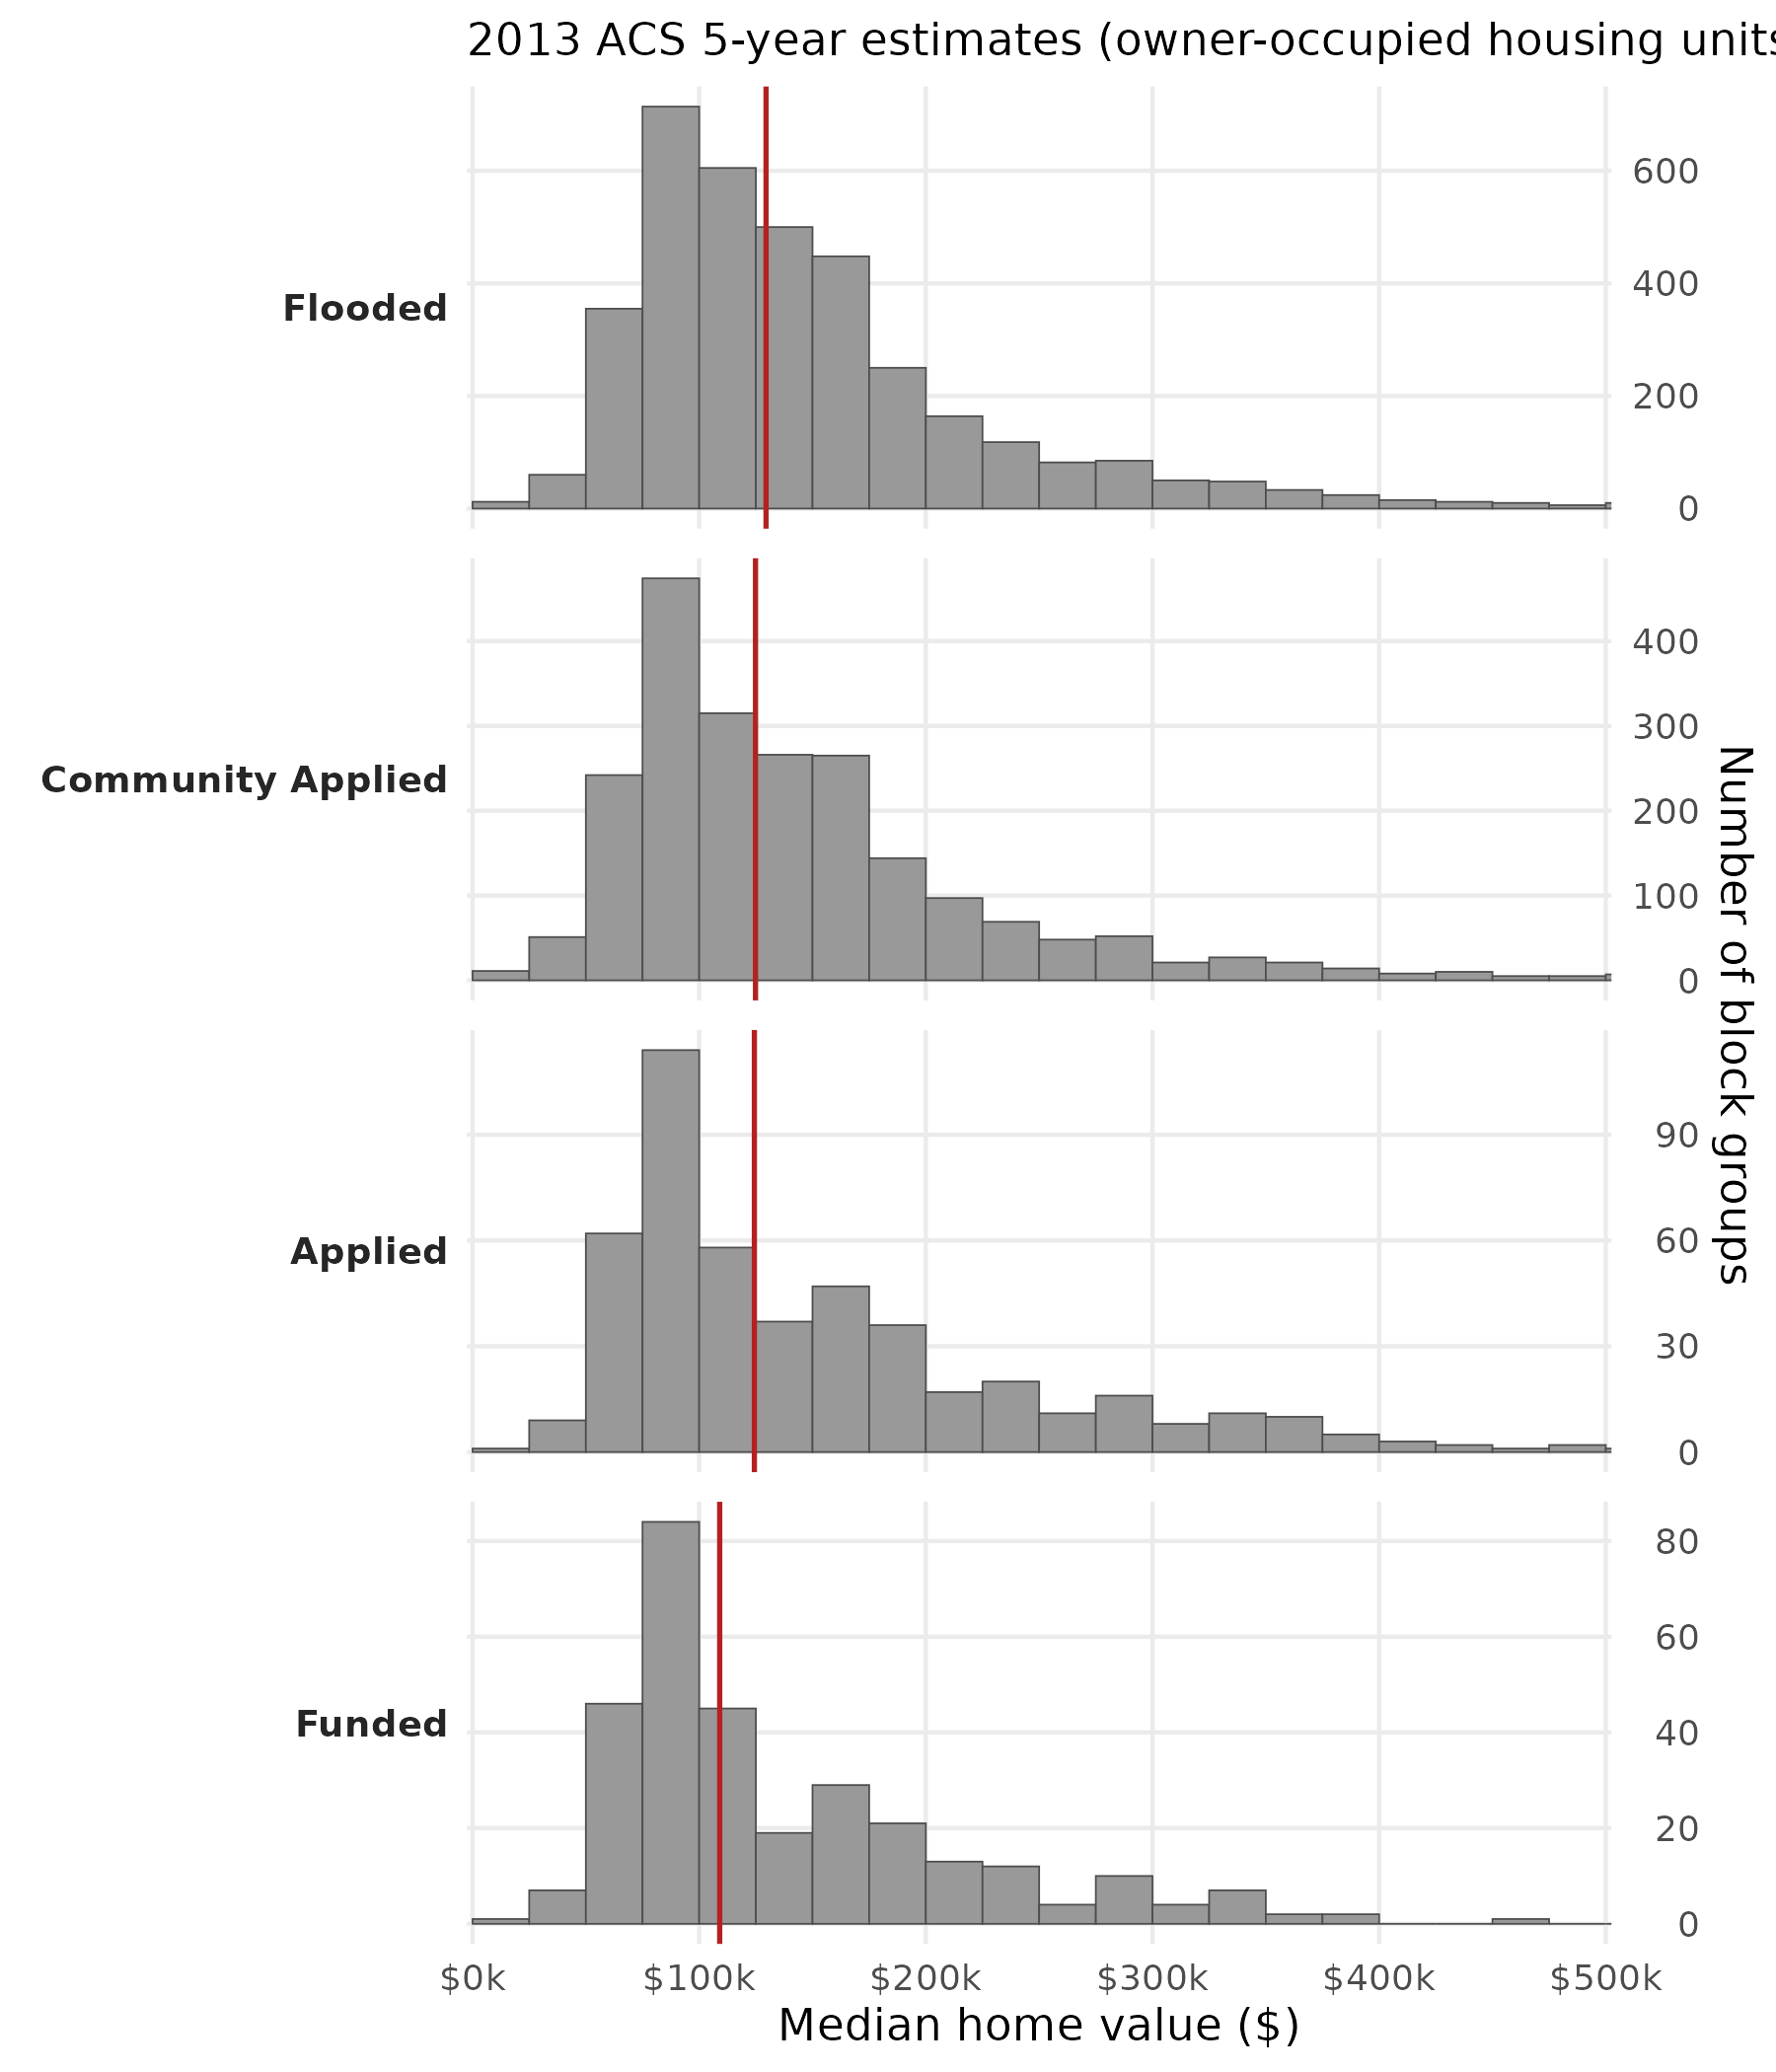
Figure 9: Block-group median home value across the HMA pipeline. Distribution of block-group median home value for owner-occupied housing (2013 ACS 5-year estimates) for block groups containing at least one residential parcel reaching each pipeline stage. Panel A shows all flood-exposed parcels; Panel B is restricted to repeat-flooded parcels. Stages from top to bottom: Flooded, Community Applied, Applied, Funded. Red vertical lines mark stage medians. The x-axis is truncated at $500,000 for readability.
S2. Race and economic correlation in the study area
Figure 10: Block-group correlation between race and economic indicators across the study area. Block-group share of non-Hispanic White residents plotted against median home value (left) and median household income (right), using 2013 American Community Survey 5-year estimates for the 4,384 study-area block groups with complete data. Red lines show ordinary least squares fits; Spearman rank correlations are reported in each panel.
S3. Buyouts versus elevations across all and repeat-flooded funded parcels
The main-text comparison of buyouts and elevations (Figure 6 in main text) restricts to the “all funded” subset. The figures below replicate that comparison while also showing the repeat-flooded subset (Panel B), to verify that the buyout-elevation divergence is not driven by event-specific dynamics.
Figure 11: Property value distributions by mitigation type, all funded versus repeat-flooded. Study-area property-value percentile distributions for funded parcels classified as buyouts (blue) versus elevations (red). Panel A includes all funded parcels with a classified project type; Panel B restricts to repeat-flooded funded parcels. Dashed vertical lines mark within-group medians. Two-sample Kolmogorov-Smirnov tests indicate the distributions differ significantly in both panels (Panel A: D = 0.141, p < 0.001; Panel B: D = 0.135, p < 0.001).
Figure 12: Neighborhood racial composition by mitigation type, all funded versus repeat-flooded. Block-group share of Black residents (2013 ACS) for funded parcels classified as buyouts (blue) versus elevations (red). Panel A includes all funded parcels with a classified project type; Panel B restricts to repeat-flooded funded parcels. Dashed vertical lines mark within-group medians. Kolmogorov-Smirnov tests indicate the distributions differ significantly in both panels (Panel A: D = 0.366, p < 0.001; Panel B: D = 0.32, p < 0.001), with buyouts consistently located in block groups with higher Black population shares.
S4. Sensitivity to high-uncertainty events
Garcia et al. (2025) flag seven of the 78 events as having unusually high ratios of modeled-flooded buildings to NFIP claims (more than 20 buildings per claim), indicating greater uncertainty in those event reconstructions. We rebuilt the full flooded-to-funded pipeline excluding these seven events to verify that our headline findings do not depend on them; the excluded events are listed in Garcia et al. and reproduced in Table 1.
Excluding the seven events meaningfully reduces the flooded-residential population (202,623 → 172,329 parcels, −14.9%) and the eligible population (141,253 → 129,685 parcels, −8.2%, attributable largely to TS Allison, the only declared event among the seven). However, only 78 of the 3,432 funded parcels in the baseline are tied exclusively to the excluded events, so the funded population shifts only marginally (3,432 → 3,354 parcels, −2.3%).
The pinch point at the application stage is essentially identical across scenarios: 4.3% of properties in applying communities themselves apply under both the baseline and the 71-event sensitivity. Median funded-stage demographics and property values shift by less than half a percentage point: median NH White share moves from 60.0% to 59.6%, median Black share from 26.1% to 26.3%, and median study-area property-value percentile from the 23rd to the 23rd. Two-sample Kolmogorov-Smirnov tests of flooded-versus-funded block-group racial distributions remain highly significant under the sensitivity scenario, with D-statistics slightly larger than the baseline (NH White: D = 0.146 versus 0.131, p < 0.001; Black: D = 0.162 versus 0.151, p < 0.001). The headline pinch-point and demographic-composition findings are therefore robust to the exclusion of the seven high-uncertainty events.
Table 1: Pipeline funnel under baseline (all 78 events) and sensitivity (71 events, excluding the seven events Garcia et al. flag as having unusually high uncertainty).
Stage
Baseline (78 events)
Sensitivity (71 events)
Change
Flooded
202,623
172,329
−14.9%
Eligible
141,253
129,685
−8.2%
Community Applied
132,828
121,713
−8.4%
Applied
5,746
5,259
−8.5%
Funded
3,432
3,354
−2.3%
Table 2: Funded-stage demographics and statistical tests under baseline vs sensitivity. All KS test p-values < 0.001 in both scenarios.
Metric
Baseline
Sensitivity
Median property value (study-area percentile)
23rd
23rd
Median NH White block-group share
60.0%
59.6%
Median Black block-group share
26.1%
26.3%
KS test: NH White (D-statistic)
0.131
0.146
KS test: Black (D-statistic)
0.151
0.162
Federal share obligations across all FEMA Hazard Mitigation Assistance programs, computed from the OpenFEMA Hazard Mitigation Assistance Projects dataset, 2015–2024.↩︎